



TL;DR
Revenue by customer cohort groups your customers based on when they joined your CSP business and tracks how revenue from each group changes over time. Instead of looking only at total monthly revenue, you can see whether customers acquired in a particular month or quarter are expanding, contracting, or churning as they mature.
For Microsoft CSPs, cohort analysis gives you a clearer view of customer quality, revenue retention, and long-term value across license subscriptions, Azure consumption, and other recurring cloud revenue. It helps you answer a question topline revenue cannot: are your newer customer cohorts becoming more valuable as they mature?
Key takeaways
- Cohort analysis separates customer quality from customer acquisition volume. Growing total revenue does not necessarily mean your newer customers are performing better.
- Track revenue from the same customer group over time. This reveals expansion, contraction, and churn that blended revenue reports can hide.
- Measure both revenue retention and cumulative revenue. One shows how well a cohort retains revenue, while the other shows how much value it creates over time.
- Compare like-for-like cohorts. Customer size, product mix, billing terms, and Azure usage can materially affect revenue patterns.
- Reliable cohort analysis starts with reliable billing data. Your customer, subscription, usage, invoice, and adjustment data need to remain connected over time.
What is revenue by customer cohort?
Revenue by customer cohort is a way of measuring your income by grouping customers according to when they started buying from you and then tracking how the revenue from each group changes over time. A customer cohort typically includes customers who share the same starting point, such as the month or quarter in which they were onboarded.
For example, your January cohort might include every customer who started buying Microsoft cloud products from you in January. You could then track the revenue generated by those customers in their first month, third month, sixth month, twelfth month, and beyond.
The important point is that the group stays consistent. You are not comparing your total business revenue in January with total revenue in February. Instead, you are following the same group of customers over time to see how their revenue changes as their relationship with your CSP business develops, giving you a clearer view of where growth is actually coming from.
How cohort revenue differs from other revenue metrics
| Metric | What it tells you |
|---|---|
| Total revenue | How large your overall revenue base is |
| New customer revenue | How much revenue newly acquired customers added |
| Cohort revenue | How the value of a specific customer intake develops over time |
Suppose you added 20 customers in one quarter and 35 in the next. At first glance, the second quarter may look stronger simply because you brought in more customers. But over the following year, those first 20 customers may retain more licenses, increase their Azure consumption, or add new services, ultimately generating more revenue than the larger cohort.
For a CSP, that distinction matters because recurring revenue growth depends on much more than winning the initial sale. What happens after the customer comes on board, whether they renew, add licenses, increase Azure usage, or buy more services, determines how valuable that relationship becomes over time.
Why total CSP revenue can hide what is happening underneath
You can grow total revenue even while the value of each new customer cohort is declining. Imagine your monthly revenue has increased 15% over the past year. On the surface, that looks like healthy growth, but that topline increase may not reflect how individual customer groups are performing.
Microsoft’s FY26 Q2 results illustrate why revenue growth needs context. Microsoft 365 Commercial cloud revenue grew 17% year over year, while Commercial seats grew 6%. Microsoft attributed growth in revenue per user to Microsoft 365 E5 and Microsoft 365 Copilot.
You may be adding enough new customers to offset revenue lost when older customers churn. A few large Azure customers may be increasing consumption while spending across the rest of your customer base declines. Or mature customers may be adding Microsoft 365 seats and upgrading SKUs, while newer customers are showing little or no growth.
Each of these scenarios can produce topline revenue growth, but the underlying customer trends are very different. Cohort analysis helps you see whether newer customers are becoming more valuable over time or whether growth is being driven by a smaller group of established accounts.
Microsoft CSP revenue can be especially difficult to interpret because customer billing can change for several reasons. New commerce subscriptions can have different term durations and billing frequencies, while changes in subscription quantities, SKUs, renewals, and scheduled updates can all affect the amount billed. Microsoft also treats usage-based services such as Azure differently from fixed-fee license products in its reconciliation data.
As a result, an increase in revenue from one month to the next does not necessarily mean that the underlying customer relationship is becoming more valuable. You need to understand what is actually driving that growth.
Once you can see how different customer cohorts perform after acquisition, you can distinguish between growth that depends on continually adding new customers and growth that comes from retaining existing customers and expanding the revenue they generate over time.
The metrics you should track for every customer cohort
A useful cohort report should do more than tell you whether revenue increased or decreased. It should help you understand what caused that change.
The following metrics provide a practical starting point. You can also track them alongside your broader Microsoft CSP KPIs to build a more complete view of business performance.
| Cohort metric | What it measures | Why it matters |
|---|---|---|
| Starting cohort revenue | Revenue generated when the cohort enters | Establishes the baseline |
| Current cohort revenue | Revenue from the same customers today | Shows how the cohort has developed |
| Expansion revenue | Additional revenue from existing customers | Captures upsell, added licenses, and consumption growth |
| Contraction revenue | Revenue lost while the customer remains active | Surfaces seat reductions and declining usage |
| Churned revenue | Revenue lost when customers leave | Measures revenue attrition |
| Gross revenue retention (GRR) | Revenue retained before expansion | Shows the durability of the original revenue base |
| Net revenue retention (NRR) | Revenue retained after expansion | Shows whether existing customer revenue is compounding |
| Revenue per customer | Average revenue generated within the cohort | Helps compare customer value |
| Cumulative cohort revenue | Total revenue generated since acquisition | Builds a view of long-term value |
Two metrics are especially useful when comparing customer cohorts: gross revenue retention (GRR) and net revenue retention (NRR).
GRR shows how much of the cohort’s original revenue remains after accounting for contraction and churn, without allowing any expansion revenue to offset those losses.
GRR = (Starting revenue - contraction - churn) ÷ starting revenue × 100
NRR goes a step further by including revenue gained through expansion.
NRR = (Starting revenue + expansion - contraction - churn) ÷ starting revenue × 100
For example, consider a cohort that started with $100,000 in monthly revenue. If it later loses $8,000 through contraction and $7,000 through churn, but gains $20,000 through expansion, its GRR would be 85%, and its NRR would be 105%.
Looking at GRR and NRR together gives you a more complete picture of cohort performance. An NRR of 105% shows that the cohort is generating more revenue overall, while a GRR of 85% shows that some of the original revenue is still being lost through contraction and churn, even with expansion offsetting those losses.
How to build a customer cohort revenue analysis for your CSP business
You do not need a complex data model to start analyzing revenue by cohort. The key is to track each customer group in a consistent way, using the same time periods and revenue metrics so that you can make meaningful comparisons across cohorts.
Step 1: Choose your cohort period
Start by deciding whether you want to group customers by the month or quarter in which they were acquired. Whichever period you choose, use it consistently across your analysis.
Monthly cohorts work well when you acquire enough customers each month to make comparisons meaningful. If customer volumes are lower, quarterly cohorts can give you a more reliable view and reduce the influence of a single large account on the results.
Step 2: Assign each customer to an acquisition cohort
Assign customers to a cohort based on when they first start generating CSP revenue, rather than when their account was initially created in your CRM or Partner Center.
This distinction matters when there is a gap between onboarding and the customer’s first billable subscription. For example, if a customer enters your CRM in February but does not make their first purchase until April, they would typically belong to the April revenue cohort.
Step 3: Establish month 0 revenue
Next, calculate the revenue generated by all customers in the cohort during their first period. This gives you the baseline against which you can track future changes.
Be consistent about what counts as revenue. If you want to measure the full Microsoft CSP relationship, you might include recurring license revenue, Azure consumption, and other relevant recurring cloud revenue. If you are analyzing a specific business line, limit the calculation to revenue from that area.
Use the same definition of revenue across every cohort so that the comparison remains meaningful. If you change what is included midway through the analysis, it becomes difficult to tell whether the difference reflects customer performance or simply a change in how revenue is being measured.
Step 4: Track the same customers over time
Follow the same group of customers at consistent intervals, such as month 1, month 3, month 6, month 12, and month 24. This allows you to see how revenue from the original cohort develops as those customer relationships mature. Do not add newly acquired customers to the cohort later, as the objective is to understand what happened to the customers who were part of the original intake.
Along with total revenue, track the changes contributing to that movement. Did customers add seats or upgrade SKUs? Did Azure consumption increase? Did some customers reduce license quantities, while others stopped generating revenue altogether? Looking at these movements alongside the topline number helps you understand what is driving the cohort’s revenue performance over time.
Step 5: Normalize billing movements
Cohort analysis becomes more complicated when you start working with actual CSP billing data because a change in the amount billed does not always reflect an equivalent change in the value of the customer relationship.
Prorations, credits, changes in billing frequency, mid-cycle seat adjustments, upgrades, cancellations, and fluctuations in usage can all affect the amount that appears on an invoice. Microsoft reconciliation data also records billing activity through charges and credits across both usage-based and non-usage-based products.
If you simply use invoice totals without accounting for these movements, temporary billing adjustments can make a cohort appear to have expanded or contracted when its underlying revenue has not changed to the same extent.
Your cohort analysis should therefore account for these billing movements so that you are comparing revenue consistently over time, rather than treating every invoice adjustment as genuine customer expansion or contraction.
Step 6: Build your cohort matrix
Once your data is consistent, display each cohort by age.
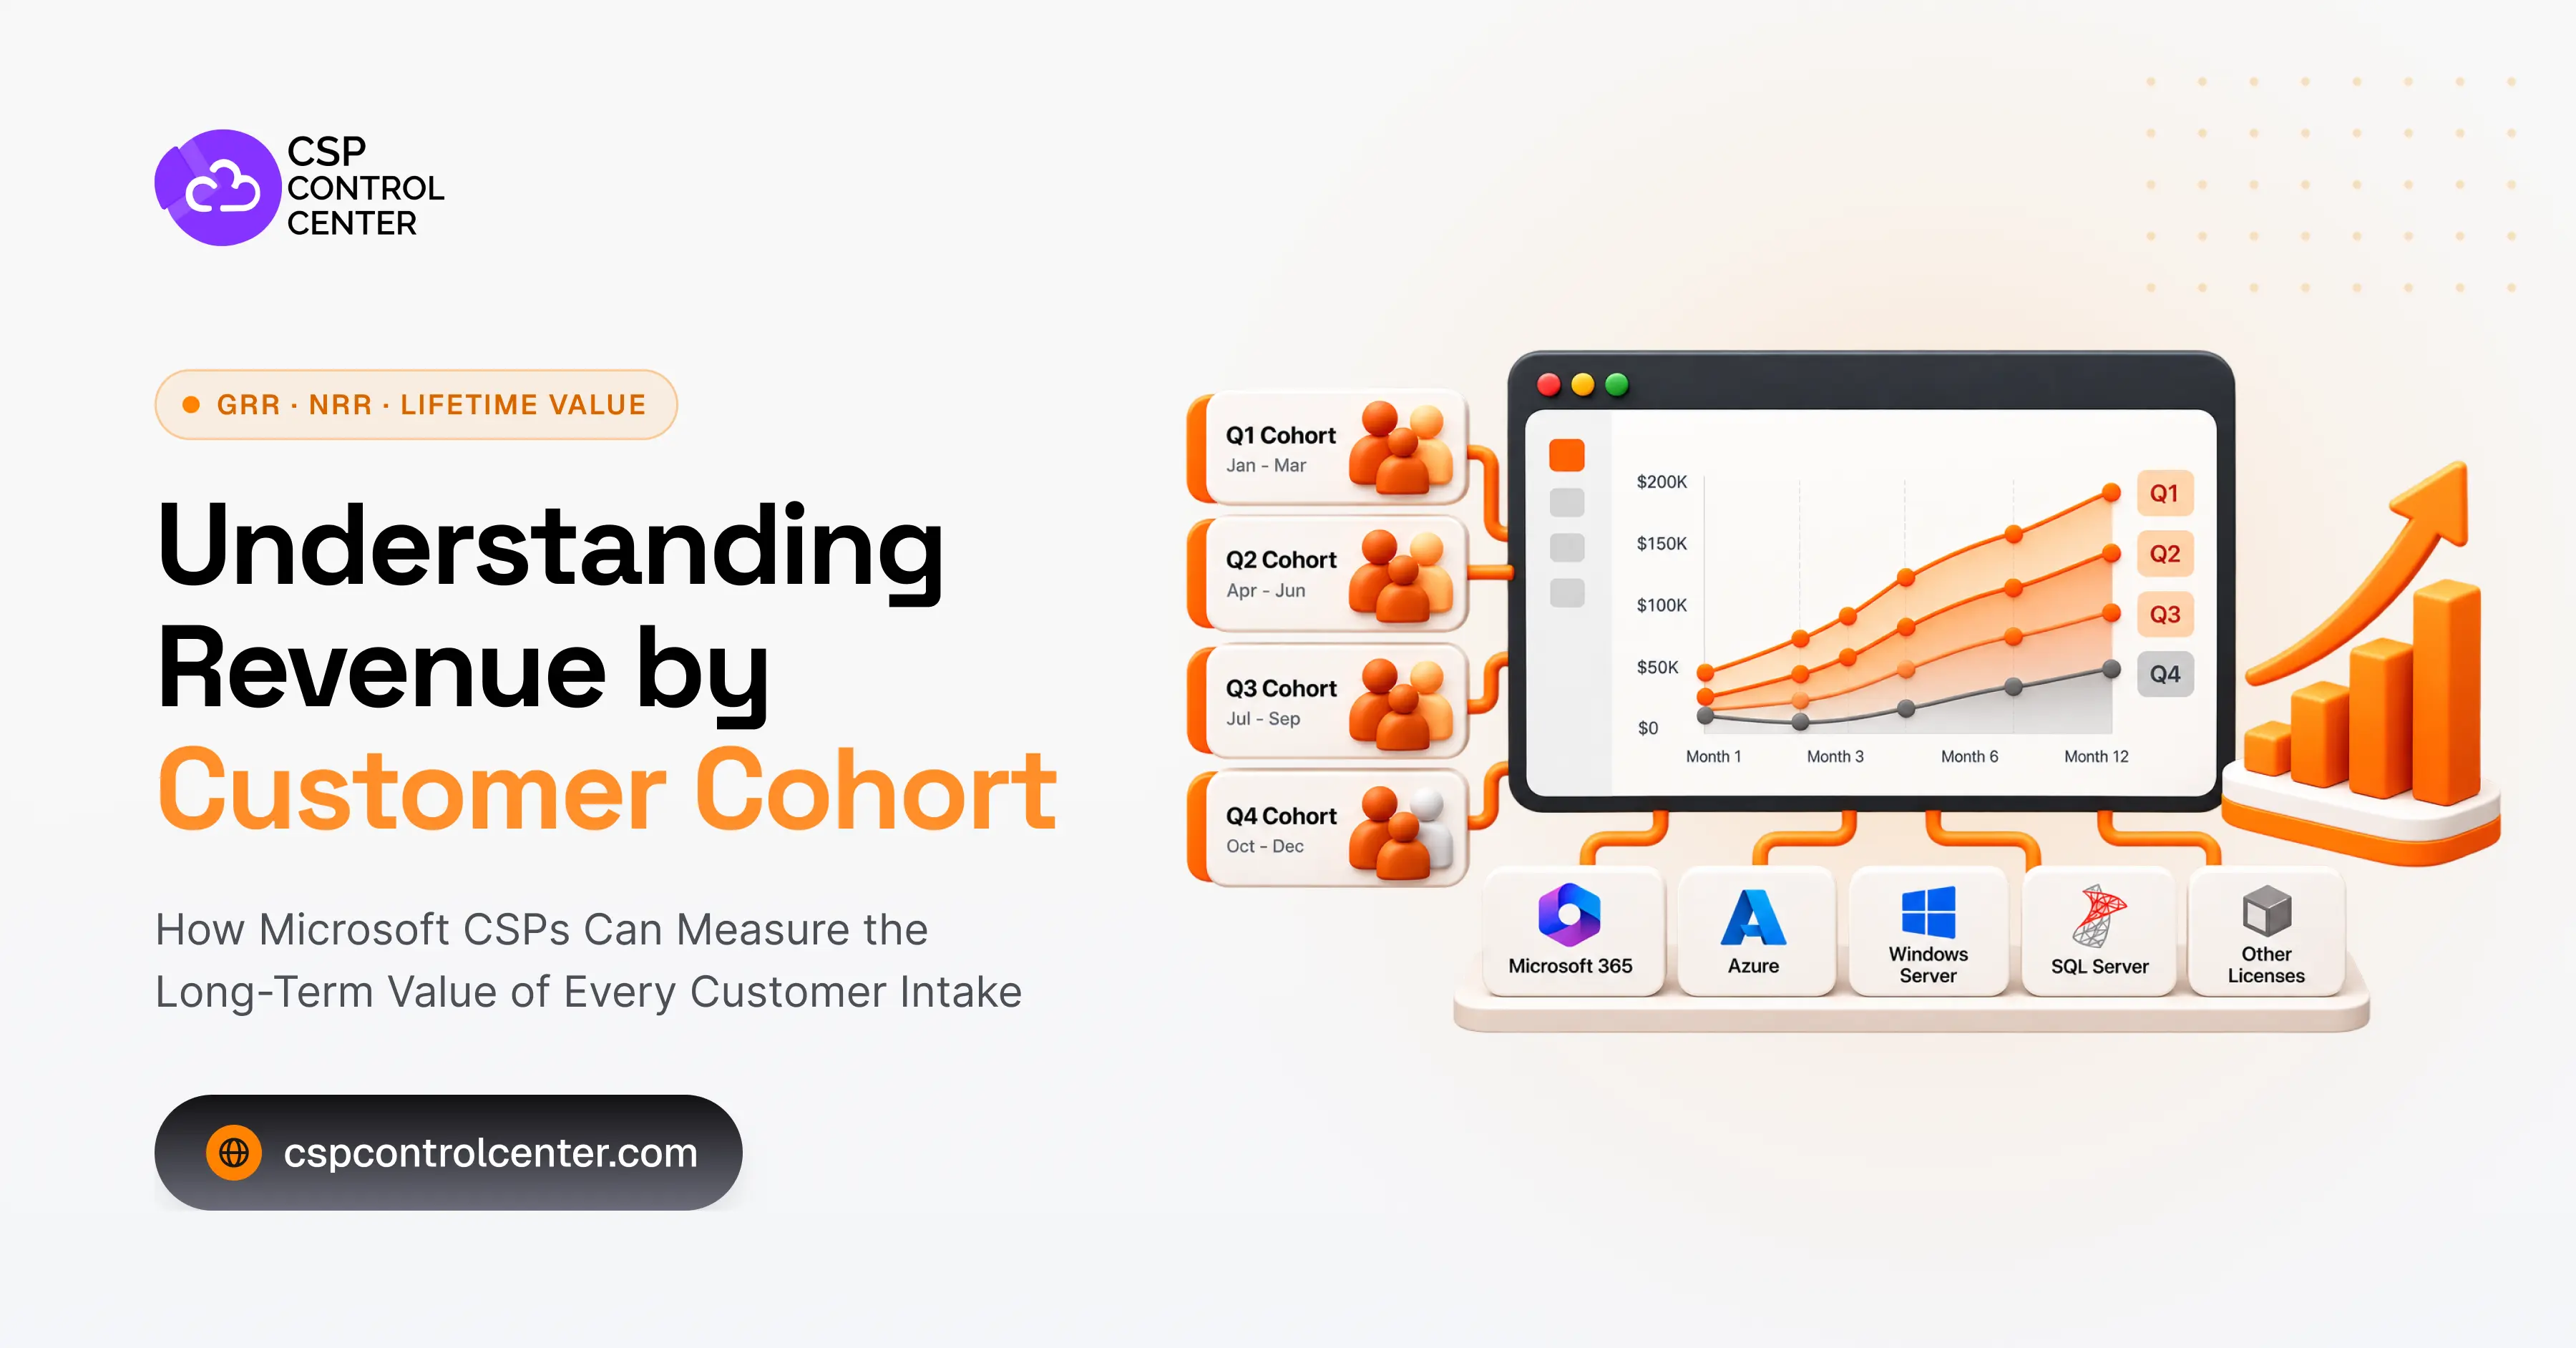
| Cohort | Month 0 | Month 3 | Month 6 | Month 12 |
|---|---|---|---|---|
| Q1 | $100K | $106K | $112K | $120K |
| Q2 | $100K | $103K | $101K | $96K |
| Q3 | $100K | $110K | $119K | N/A |
The table makes the differences between cohorts easier to see. Q1 shows steady expansion, Q2 grows initially before falling below its starting revenue, while Q3 shows stronger growth in its early months.
You can also set each cohort’s starting revenue to 100% and measure subsequent periods against that baseline. This removes differences in cohort size and makes it easier to compare how quickly revenue from each customer group grows or declines over time.
From cohort revenue to long-term customer value
Tracking cohort revenue over time shows whether a customer group is expanding, contracting, or remaining relatively stable. Cumulative cohort revenue takes this further by showing how much revenue that group has generated since it was acquired.
This allows you to look beyond retention at a particular point in time and understand how the value of each customer cohort builds over the course of the relationship.
Calculate cumulative revenue per original customer
For each cohort, add up the revenue generated across all periods and divide it by the number of customers in the original group.
Cumulative revenue per customer = Total cohort revenue generated to date ÷ Number of customers in the original cohort
You can then compare cohorts at the same milestones, such as month 6, month 12, and month 24, to see how much revenue each customer intake has generated over an equivalent period.
Keep the denominator based on the original number of customers in the cohort. If you calculate the figure using only customers that are still active, churned customers are excluded, and the average revenue per customer will appear higher than it actually is.
Use the cohort curve to estimate future customer lifetime value
Once you have enough historical data, mature cohorts can help you build a more evidence-based view of customer lifetime value. Instead of assuming that every customer follows the same average trajectory, compare factors such as:
● 12-month cumulative revenue per original customer
● 24-month cumulative revenue per original customer
● The speed at which different cohorts expand or contract
● How long customer revenue typically persists
You can then use these patterns to set more informed expectations for newer cohorts based on how similar customer groups have performed over time.
The next step is to look at margin. Two cohorts may generate the same cumulative revenue but deliver very different economic value if one depends on deeper discounts, includes a lower-margin product mix, or requires significantly more support.
Over time, the analysis can therefore progress from cohort revenue to cumulative revenue, estimated lifetime value, and ultimately margin-based customer value.
Billing Data Problems That Break Cohort Analysis
The calculations behind cohort analysis are quite simple. For many Microsoft CSPs, the bigger challenge is making sure the historical billing data used in those calculations is accurate and consistent. Your cohort analysis is only as reliable as the customer, subscription, usage, and billing records behind it.
The wider cost of poor data quality can also be significant. Gartner estimates that poor data quality costs organizations at least $12.9 million per year on average, highlighting the importance of maintaining accurate and consistent data across systems.
| Billing data problem | Effect on cohort analysis | What you need to do |
|---|---|---|
| Mid-term seat changes and proration | Temporary billing movements can look like expansion or contraction | Separate recurring value changes from prorated adjustments |
| Multiple Microsoft billing records | Revenue and cost can be difficult to reconcile by customer | Maintain consistent customer and subscription mapping |
| Manual spreadsheets | Different files can contain different versions of the same data | Create one controlled billing data source |
| Customer or tenant changes | The same customer may appear as multiple records | Preserve a persistent customer identity |
| Late credits and adjustments | Historical months can change after reporting | Define how adjustments are applied to prior cohorts |
| Variable Azure usage | Normal consumption volatility can look like structural growth or decline | Compare trends over multiple periods and isolate material changes |
Mid-term subscription changes can make cohort trends harder to interpret. For example, if a customer adds licenses halfway through a billing cycle, the first invoice may include only a prorated charge, while the full recurring revenue increase appears in the following cycle.
Azure consumption can also vary naturally from month to month, so a temporary drop in usage does not necessarily mean that the customer is contracting. To track cohorts accurately over time, you therefore need consistent customer and subscription records alongside reliable usage, invoice, credit, and adjustment data.
What Cohort Insights Tell You to Do
Cohort analysis becomes useful when the patterns you identify lead to changes in how you manage the business.
If certain cohorts retain and expand more successfully than others, you can use those differences to improve how you acquire customers, structure pricing, manage retention, and identify opportunities for growth within existing accounts.
Refine acquisition
Compare cohorts by acquisition source, customer size, industry, geography, or product mix. You may find that one channel brings in more customers, while another delivers stronger retention and generates more revenue over time.
This helps you understand which acquisition channels and customer segments create greater long-term value, rather than focusing only on how many new customers you bring in.
Improve retention and expansion
Cohort patterns can help you identify when customer revenue typically starts to decline and when expansion tends to happen.
If several cohorts begin to contract at a similar point in the customer lifecycle, you can look more closely at onboarding, pricing, product fit, or renewal risk before revenue starts to fall. Similarly, if customers tend to expand after adopting a particular product or service, you can use that pattern to identify the right time for relevant cross-sell and upsell conversations.
Strengthen forecasting and customer prioritization
Historical cohort performance can also help you build more realistic revenue forecasts. Rather than assuming that each customer will continue generating the same level of revenue, you can factor in the expansion and contraction patterns seen across earlier cohorts.
These patterns can also highlight customer groups that are beginning to decline, giving your customer success teams an opportunity to engage before more revenue is lost.
Over time, this gives you a clearer view of which customer groups are contributing to sustained growth and which may require more attention.
How Billing Automation Makes Cohort Reporting Sustainable
You can build an initial cohort analysis in a spreadsheet, but maintaining it becomes harder as customer volumes, subscriptions, Azure usage, credits, and billing adjustments grow.
Cohort reporting depends on having consistent customer-level billing history over time. Automating billing and reconciliation helps keep that data more accurate, traceable, and easier to analyze as your CSP business scales.
| Area | Manual spreadsheet approach | Automated billing platform |
|---|---|---|
| Data accuracy | Prone to copy errors and version drift | More consistent customer- and subscription-level records |
| Time to insight | Requires manual preparation each cycle | Data is easier to prepare and analyze |
| Scalability | Slows down as customers and subscriptions grow | Scales more efficiently as billing volume grows |
| Audit trail | Harder to trace changes across files | Maintains a more consistent billing history |
Measure the quality of growth, not just the topline
Total revenue tells you how much your CSP business is generating today. Cohort analysis helps you understand how the customers behind that revenue are performing over time. By tracking how each customer group expands, contracts, and builds cumulative revenue, you can see which cohorts are contributing to sustained growth, where revenue is beginning to decline, and which customer segments may need more attention.
The quality of these insights, however, depends on the billing data behind them. Consistent customer, subscription, usage, invoice, and adjustment data gives you a reliable foundation for measuring retention, understanding long-term customer value, and assessing the quality of your revenue.
Build a stronger foundation for cohort analysis with C3
Cohort analysis is only as reliable as the billing data behind it. CSP Control Center(C3) helps you keep customer, subscription, Azure usage, proration, reconciliation, and billing records connected over time, giving you a stronger data foundation to track how different customer groups perform.
With customer and product analytics, Azure usage reporting, and revenue-versus-cost visibility, you can move beyond topline billing and build a clearer view of retention, expansion, and long-term customer value.
Book a demo to see how automated billing and reporting can support better cohort and revenue analysis.
FAQs
What is customer cohort analysis for Microsoft CSPs?
It groups customers by when they started generating revenue and tracks how that same group performs over time, including expansion, contraction, and churn.
How do you calculate revenue retention for a CSP customer cohort?
Use GRR to measure retained revenue before expansion and NRR to include expansion. Together, they show both underlying retention and overall cohort growth.
What is the difference between customer lifetime value and cohort revenue?
Cohort revenue is the observed revenue path of a customer group, based on actual performance over time. Customer lifetime value is an estimate of the total value a customer is expected to generate. Cohort revenue gives you the historical evidence to build a more reliable LTV estimate.
How often should Microsoft CSPs review customer cohorts?
Monthly reviews work well for operational monitoring, while quarterly reviews are better for comparing broader trends across customer intakes.