






Live business dashboard
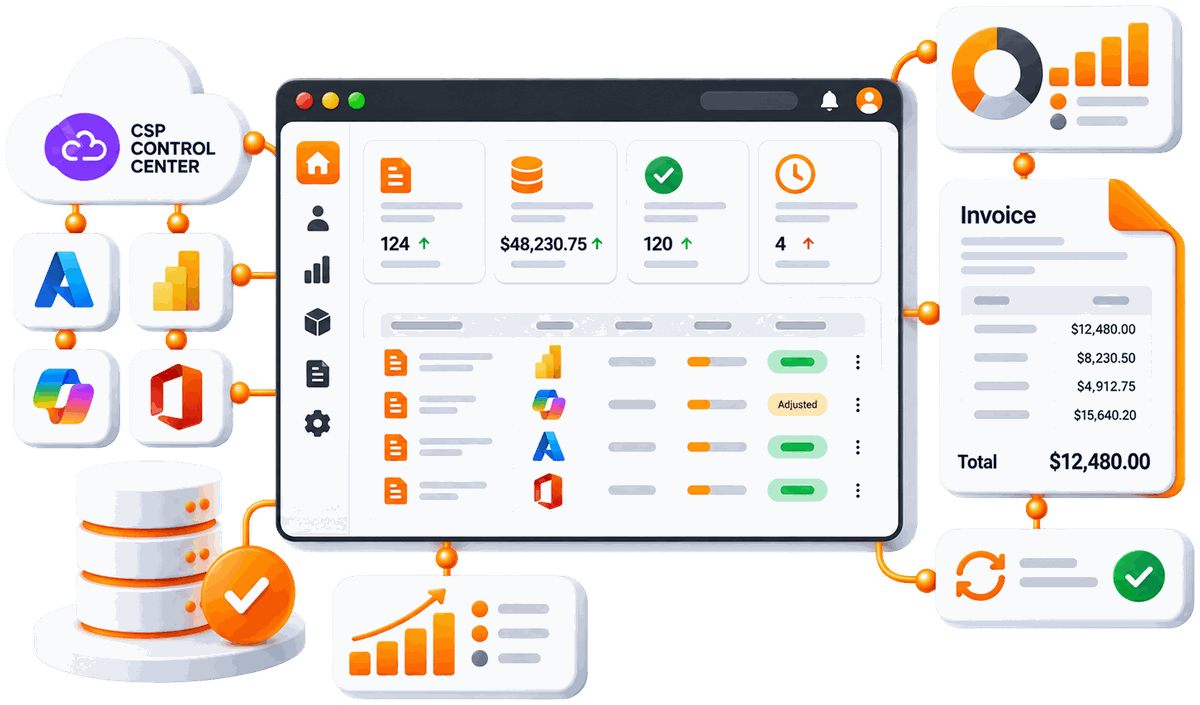
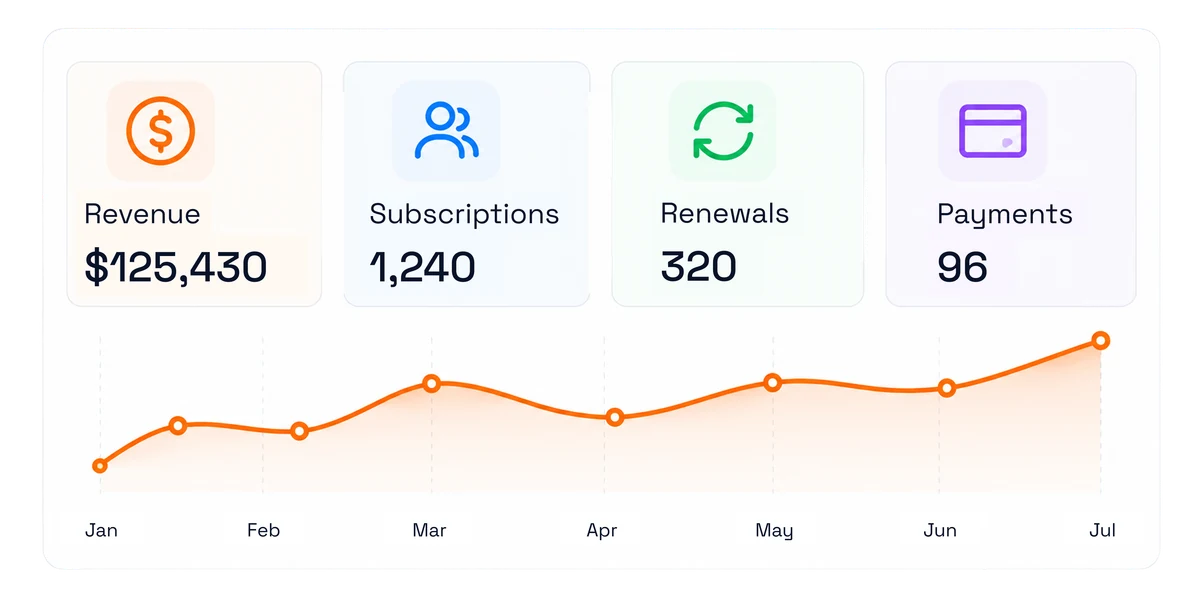
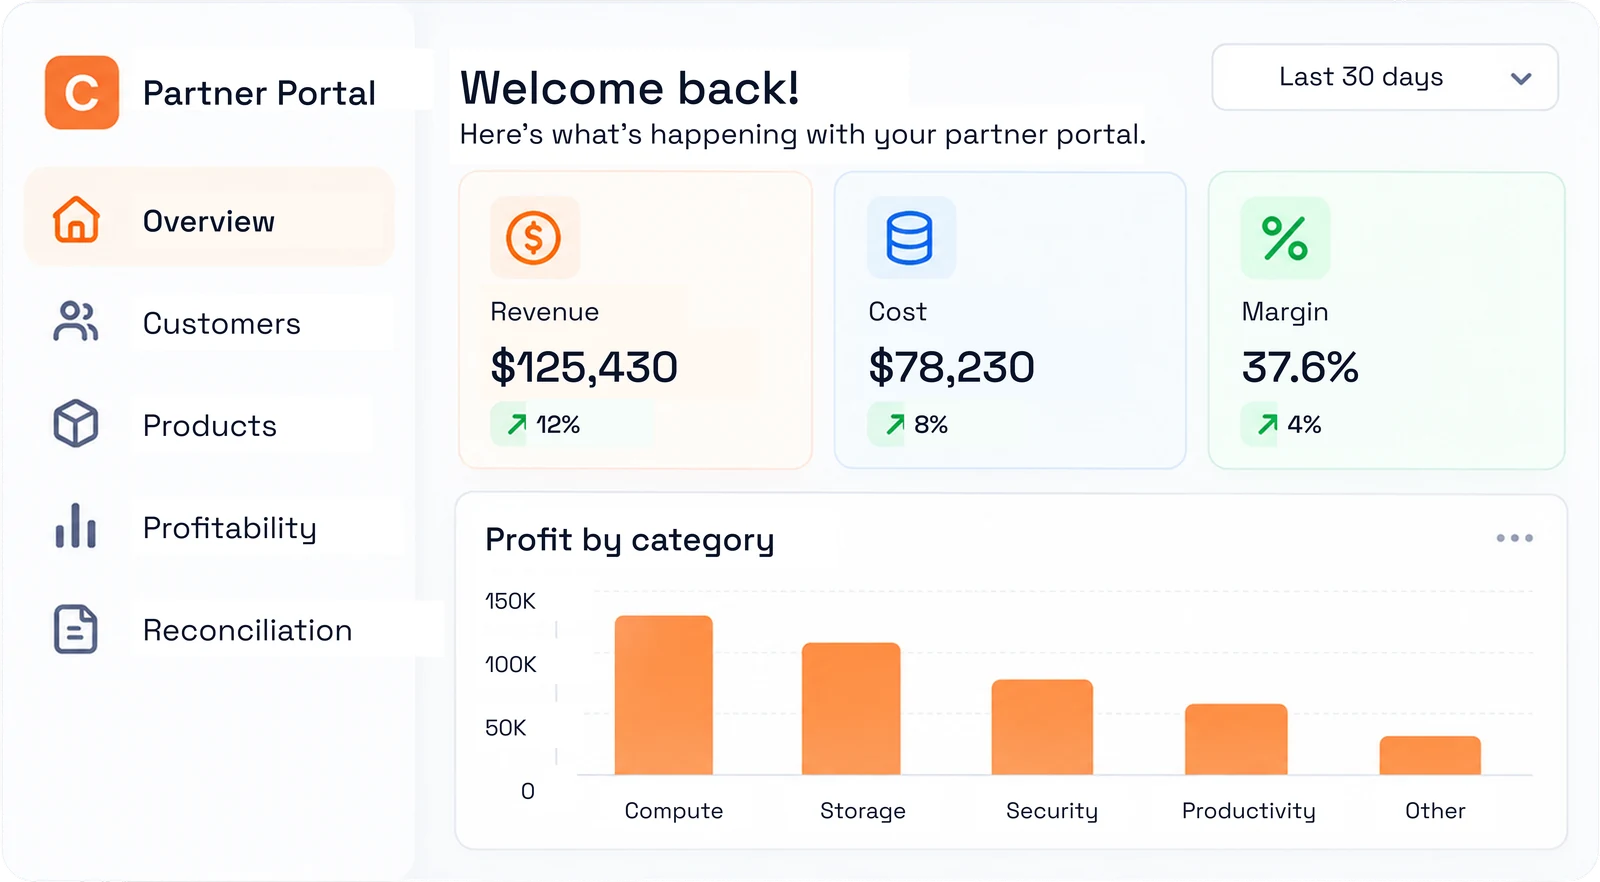
Revenue, subscriptions, renewals and payment status the moment you log in. Filter any portlet by time period, export it as PNG or CSV, and add your own custom tiles.
See revenue, margin, Azure consumption, and renewals in real time, with detailed reports and Power BI analytics on demand.







Revenue, subscriptions, renewals and payment status the moment you log in. Filter any portlet by time period, export it as PNG or CSV, and add your own custom tiles.
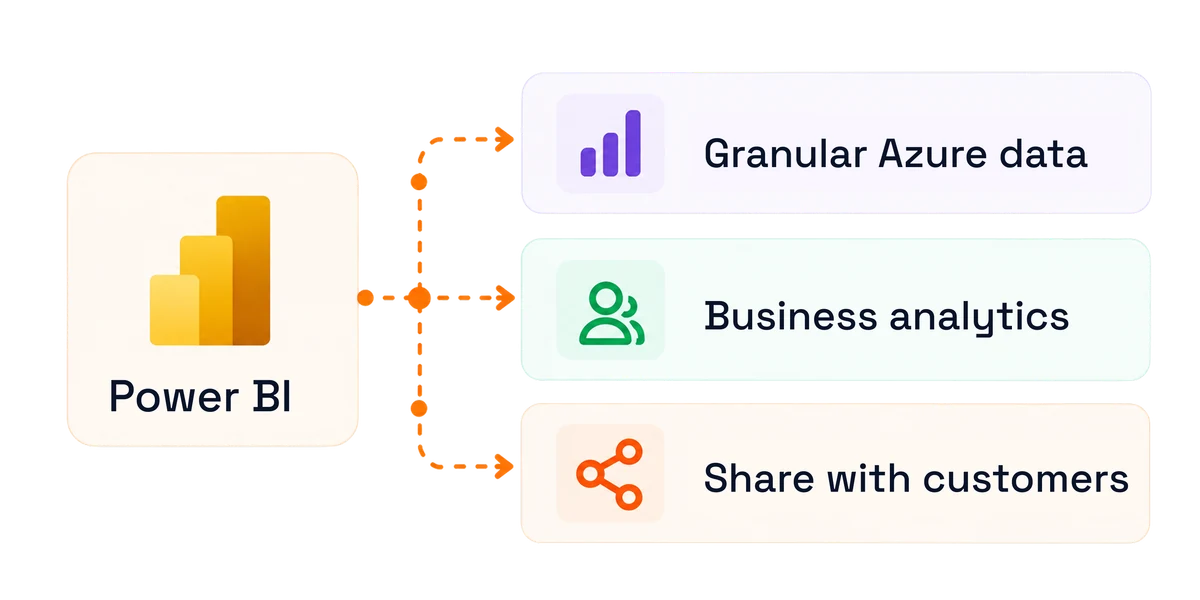
Granular Azure and business analytics on live C3 data, extendable to customers. Schedule reports to deliver automatically, or pull the data into your own BI tools.
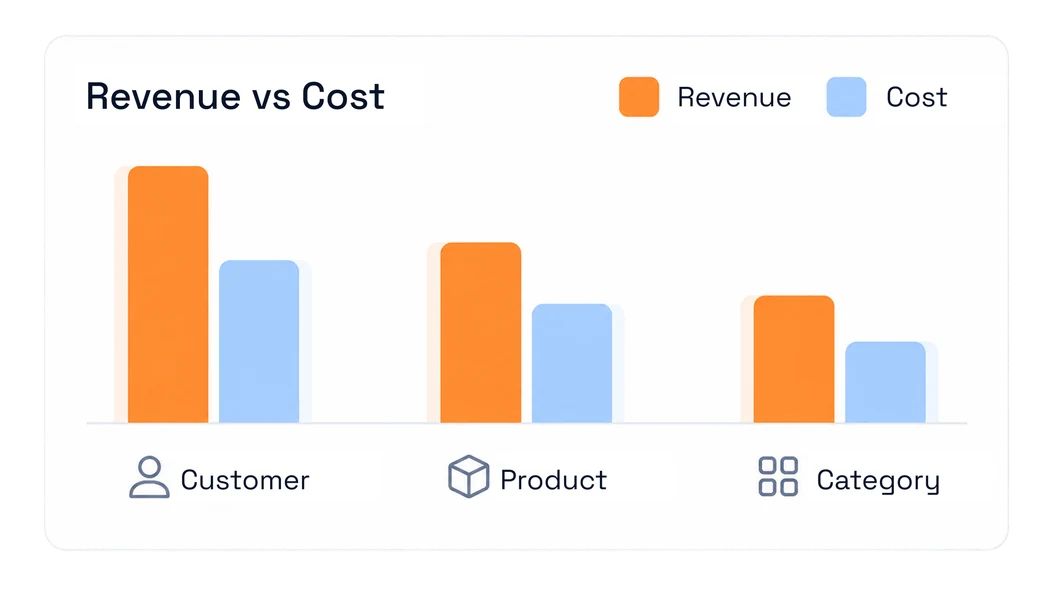
Revenue analyzed against cost by customer, product, category and billing cycle. Distributor reports break margin down per reseller, with commissions alongside.
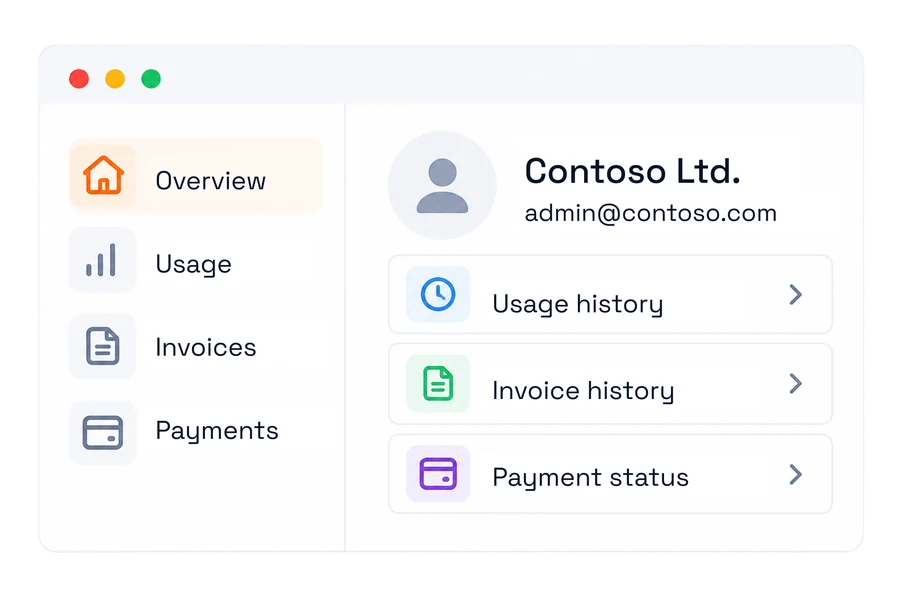
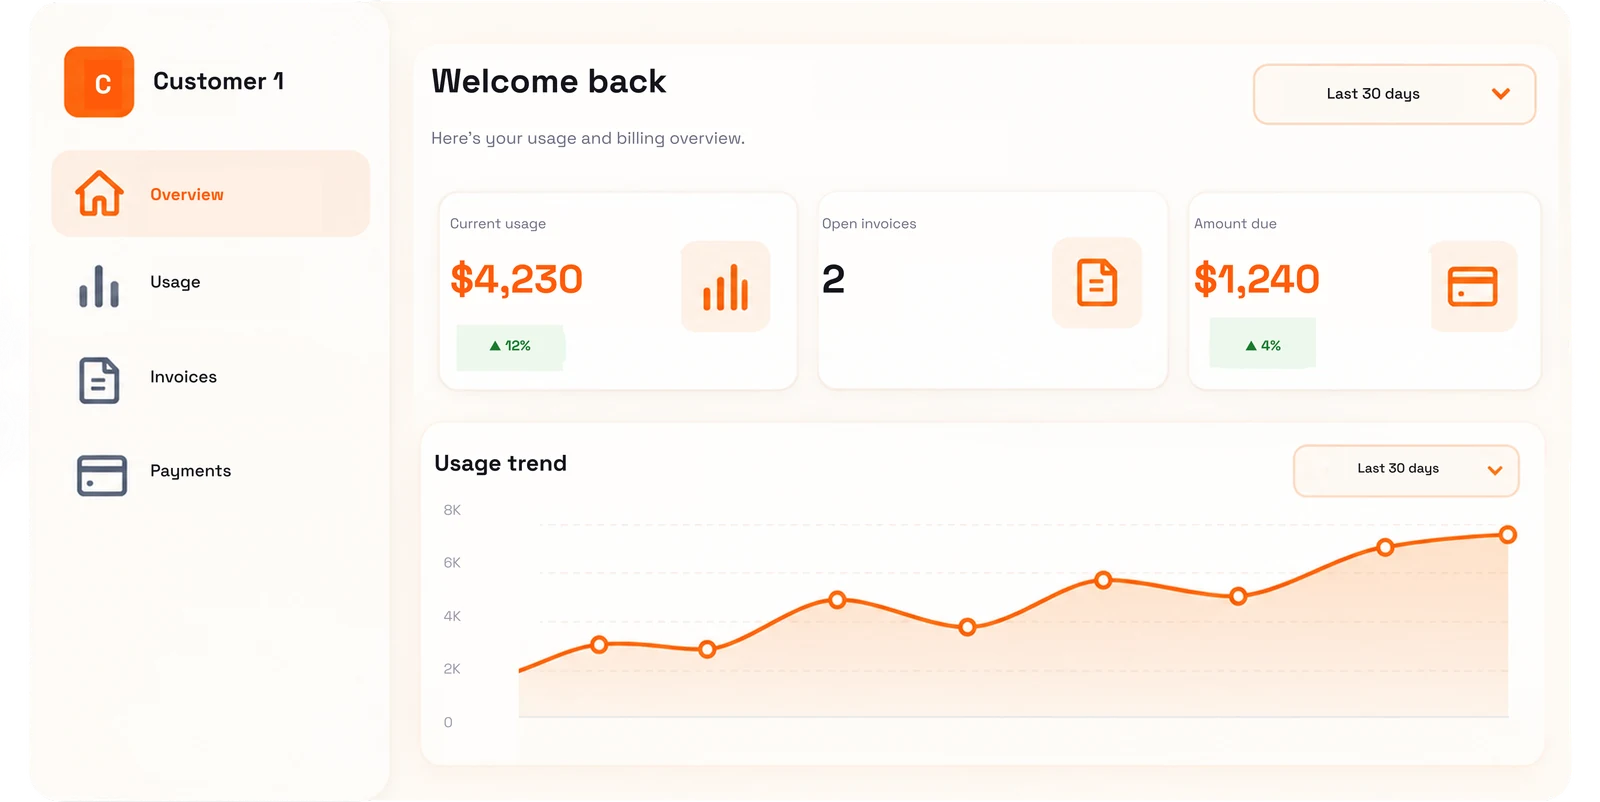
Usage, consumption, invoices and billing history inside your customer portal. Role-based scoping keeps every team and reseller to the view they should see.
Business analytics
Revenue, margin, Azure consumption and renewals — the whole reporting picture, on your current data.
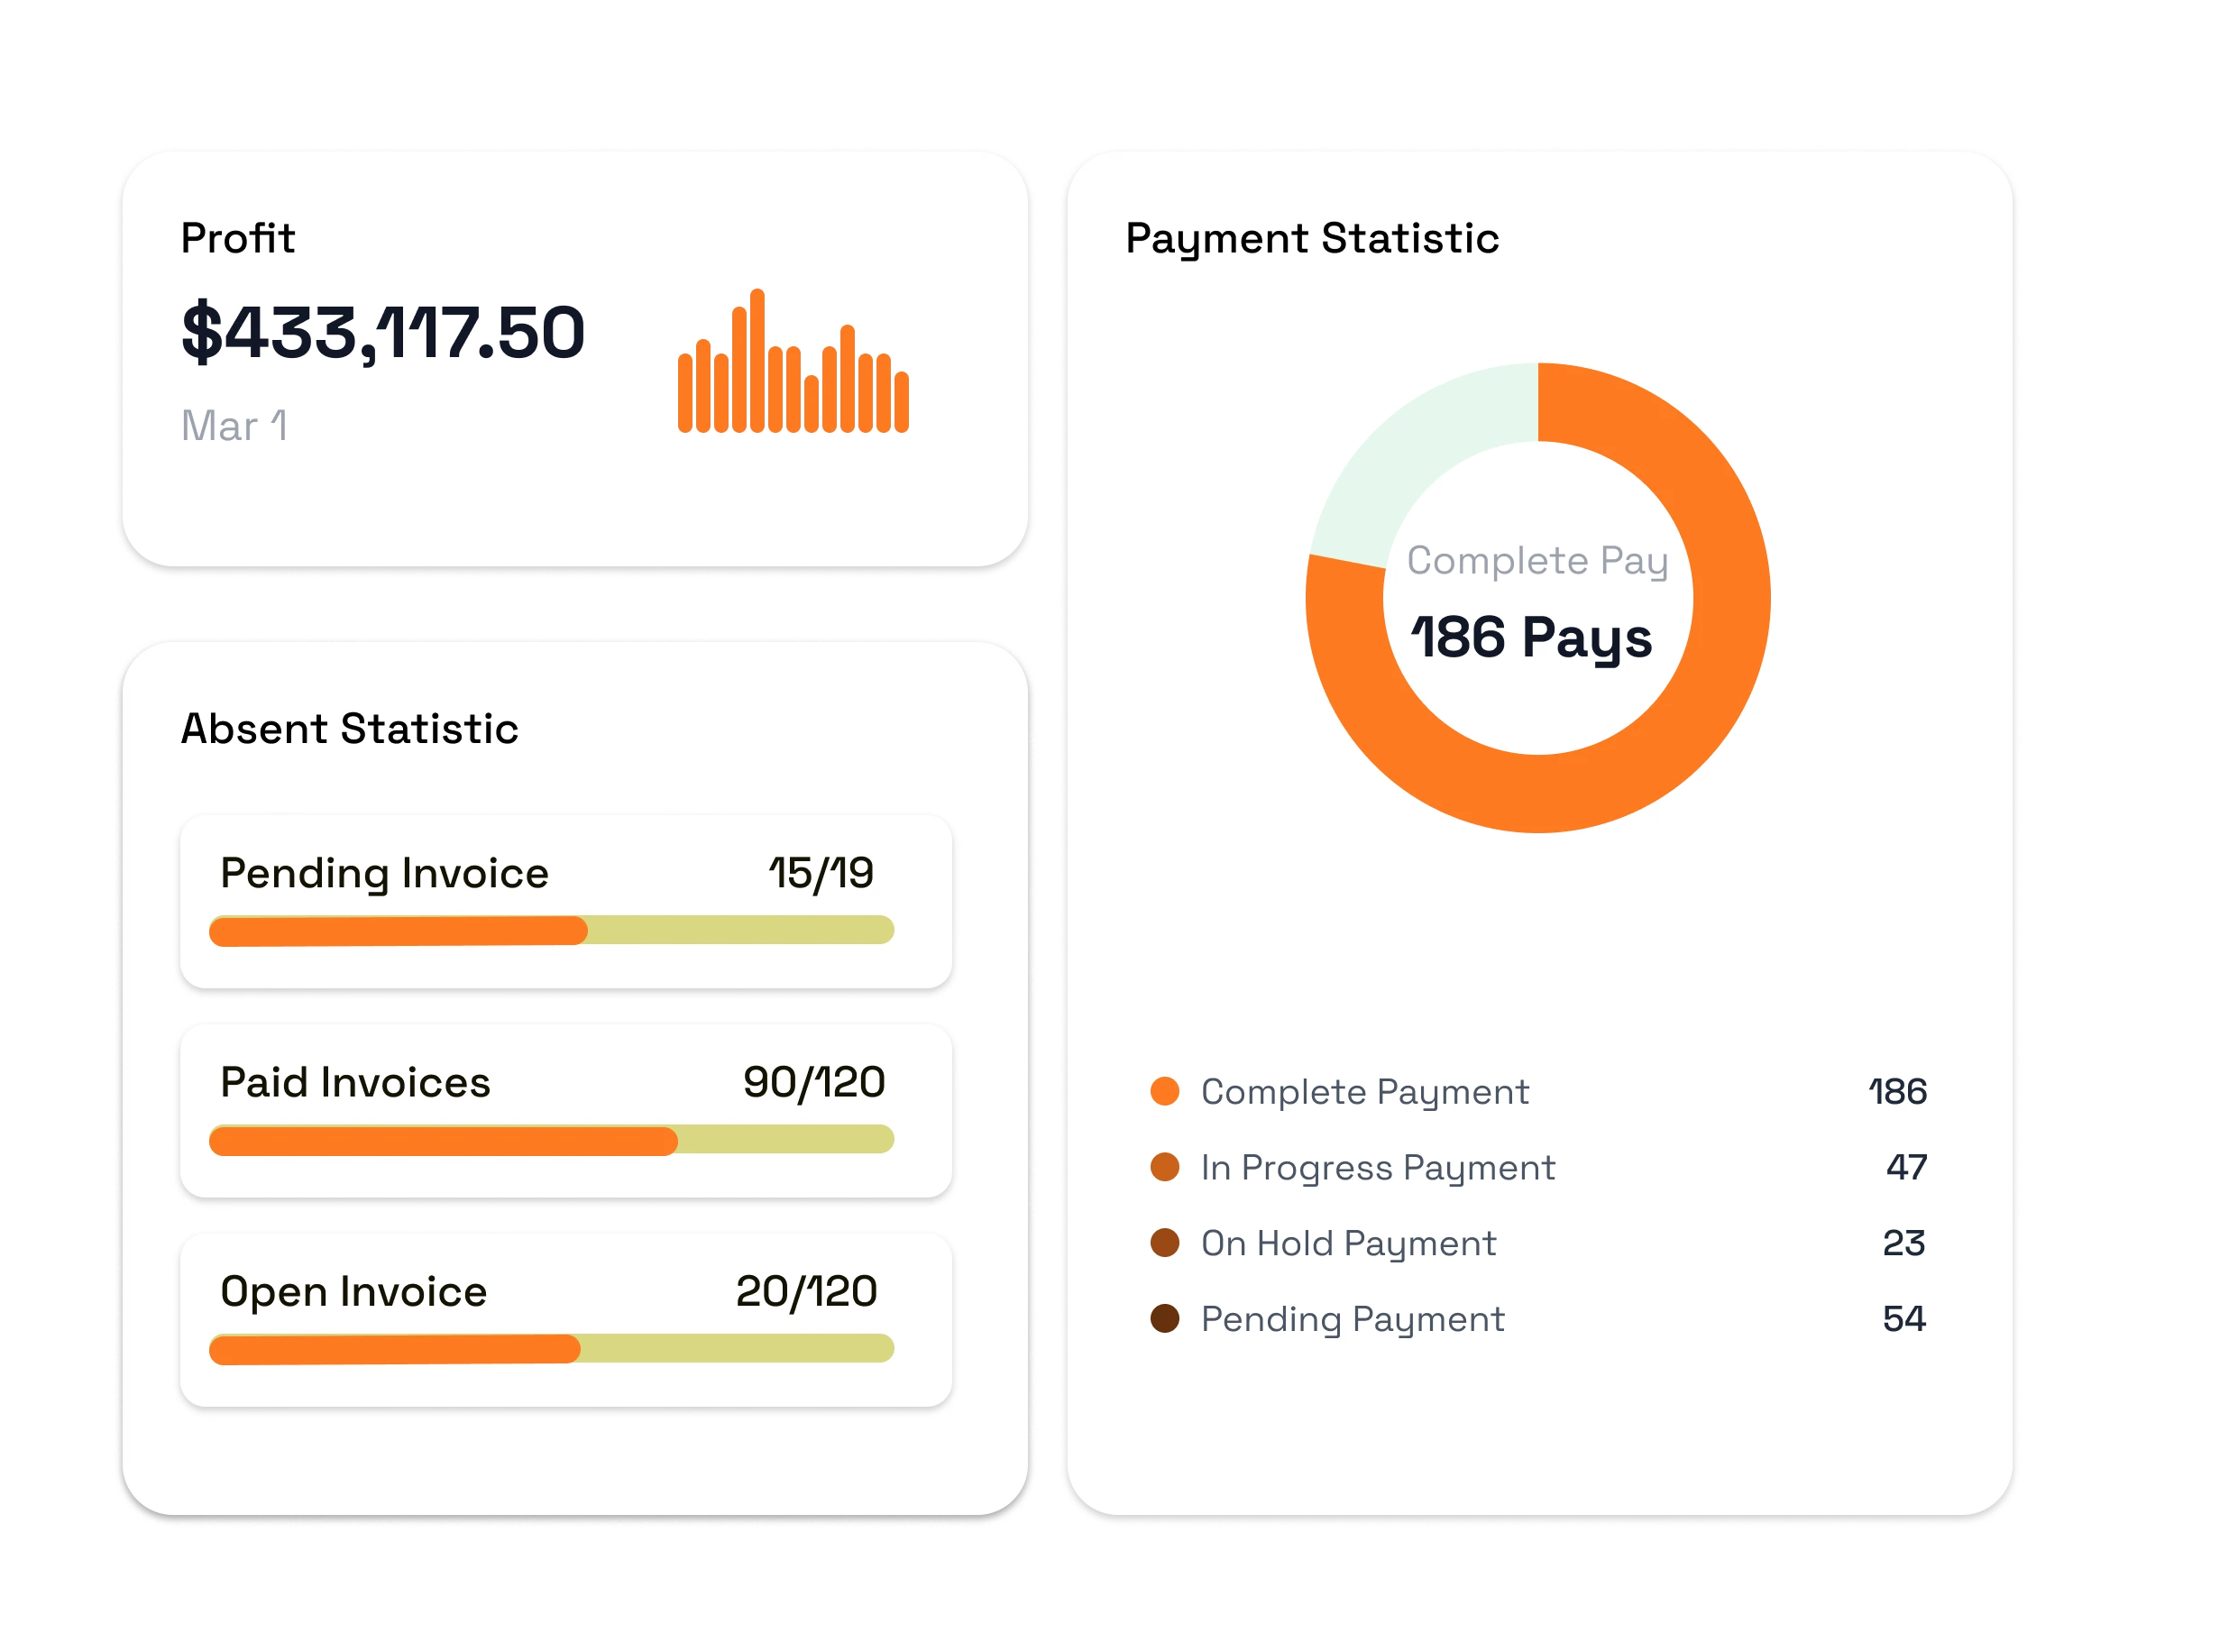
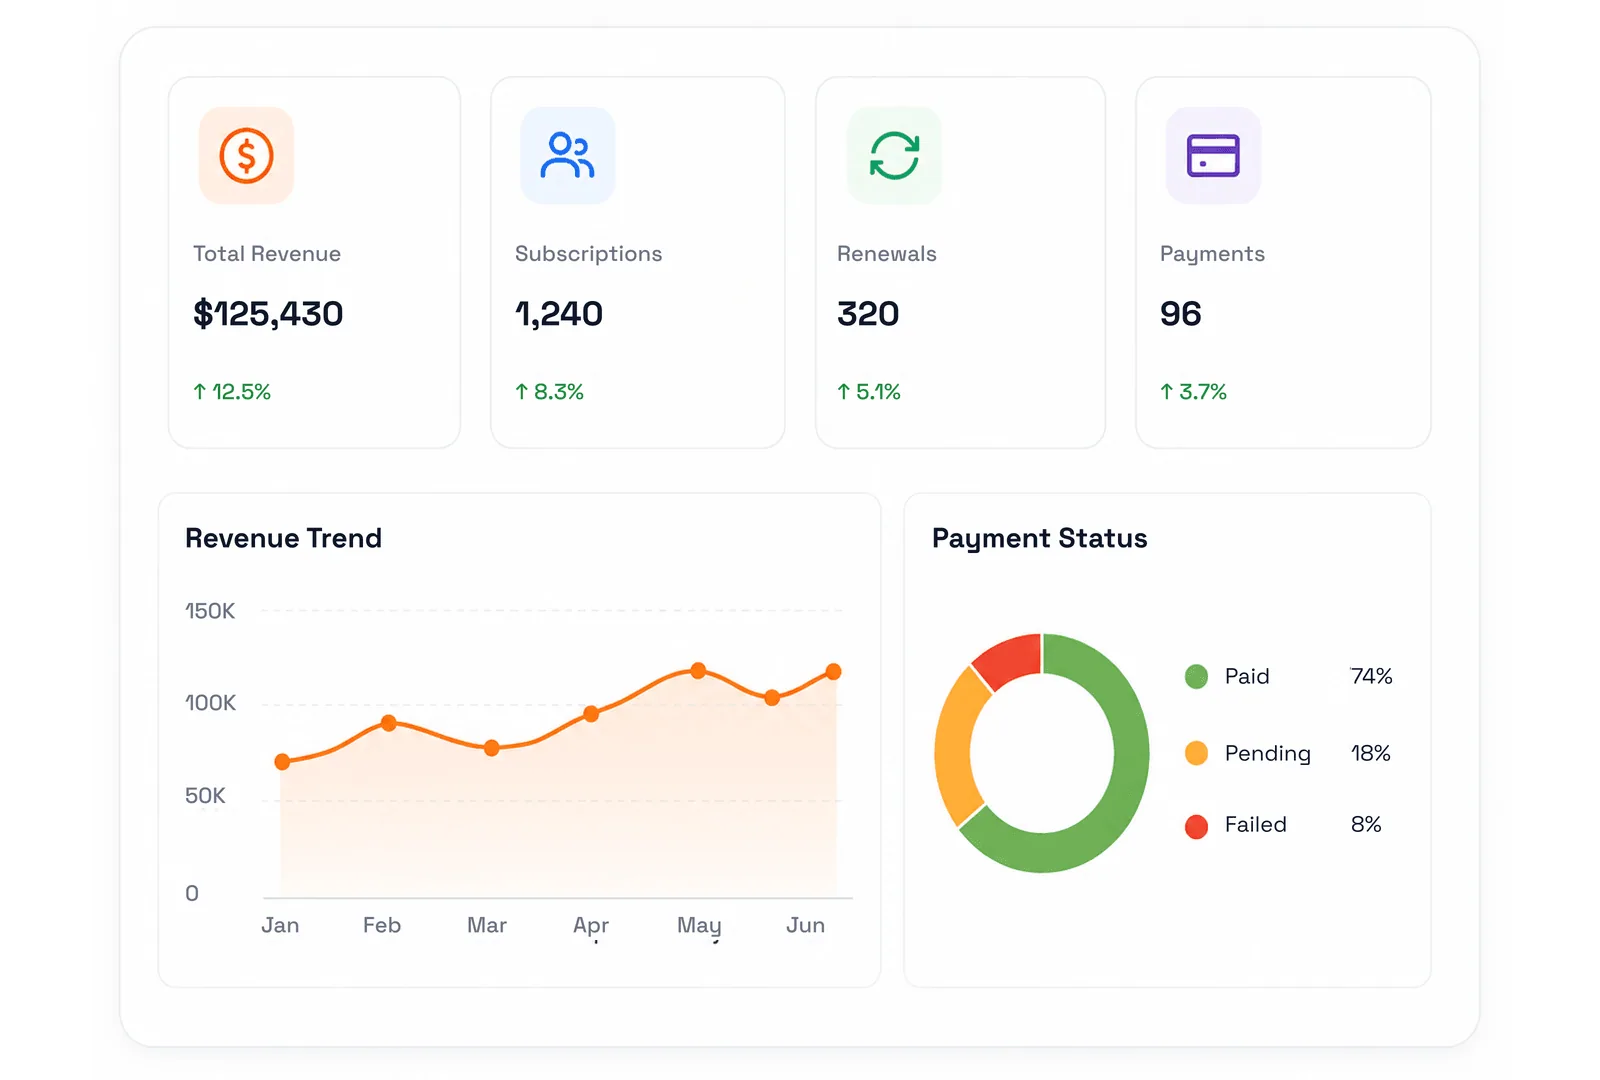
Revenue, subscriptions, renewals and payment status are on screen the moment you log in, so nothing important stays hidden until month-end. The dashboard opens on total revenue for the period, active subscription and renewal counts and a payment breakdown across paid, pending and failed, with the revenue trend beside it. Every portlet reads your live C3 data, so the figures on screen are the figures your team is working with today.
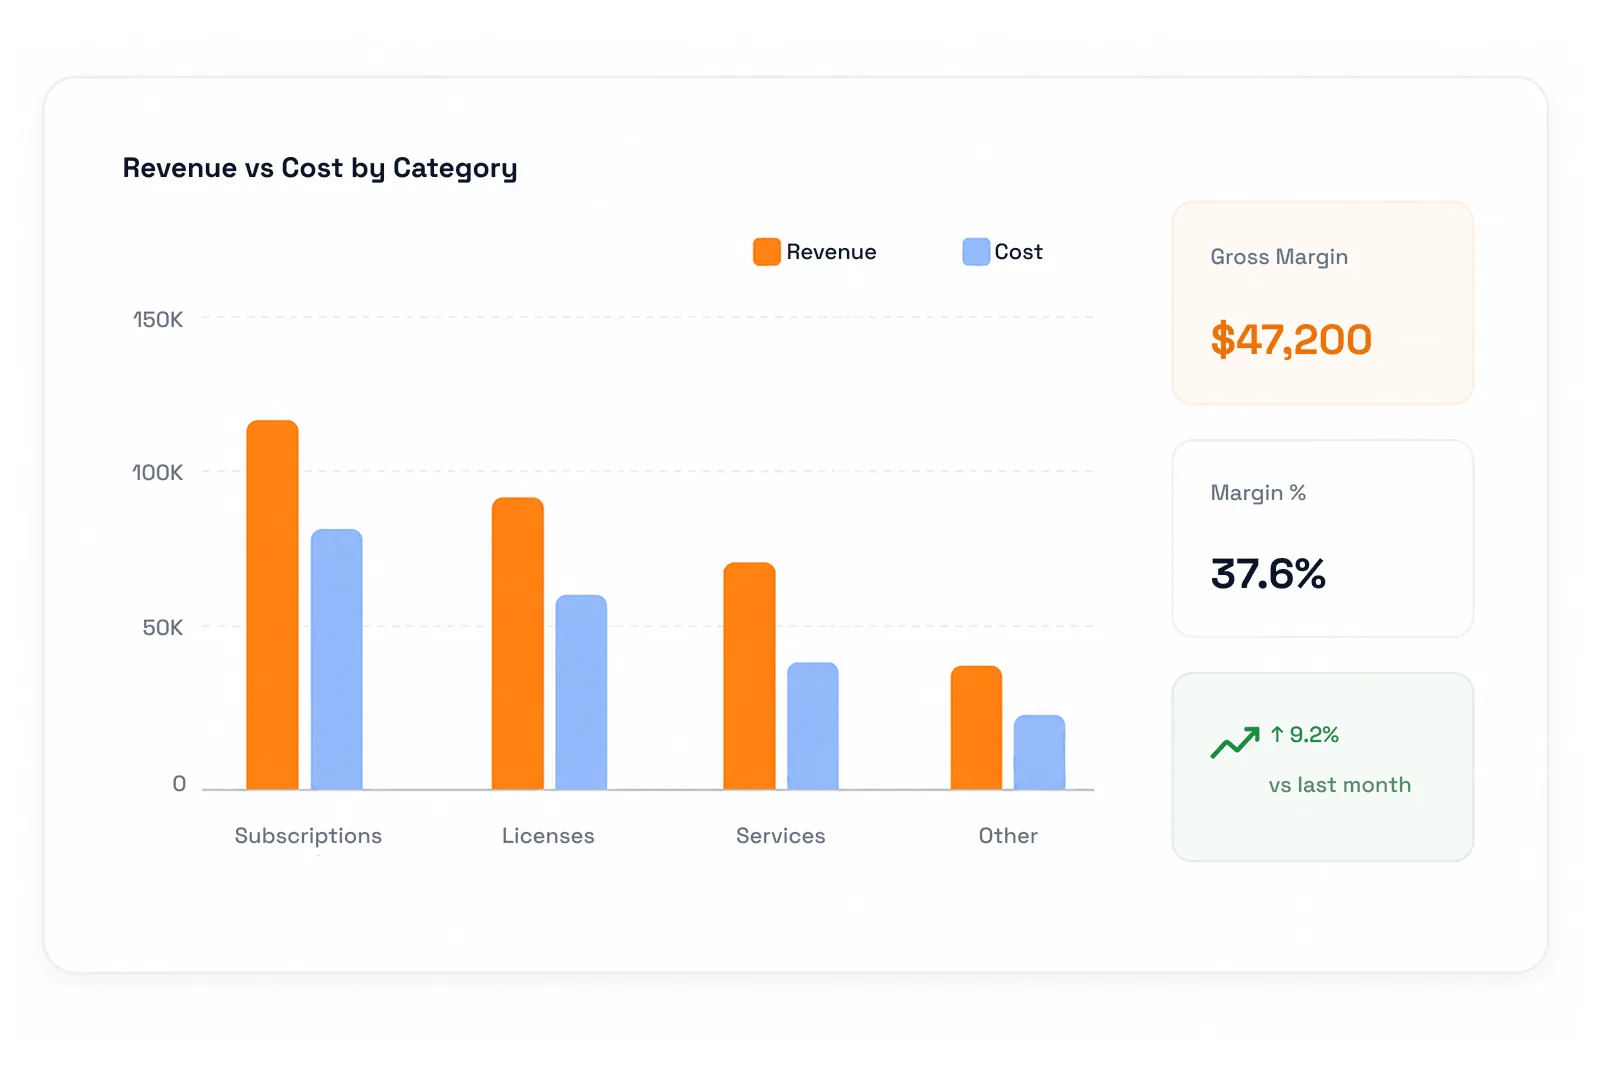
Analyze revenue against cost by category, customer and billing cycle, and see profitability where it is actually made rather than only in aggregate. Gross margin, margin percentage and the movement against last month sit on the dashboard itself, so a drop is visible in the period it happens, and the Revenue and Cost Summary report breaks the same figures down across customers, products and usage types. Distributors get the reseller-level view of margin per reseller.
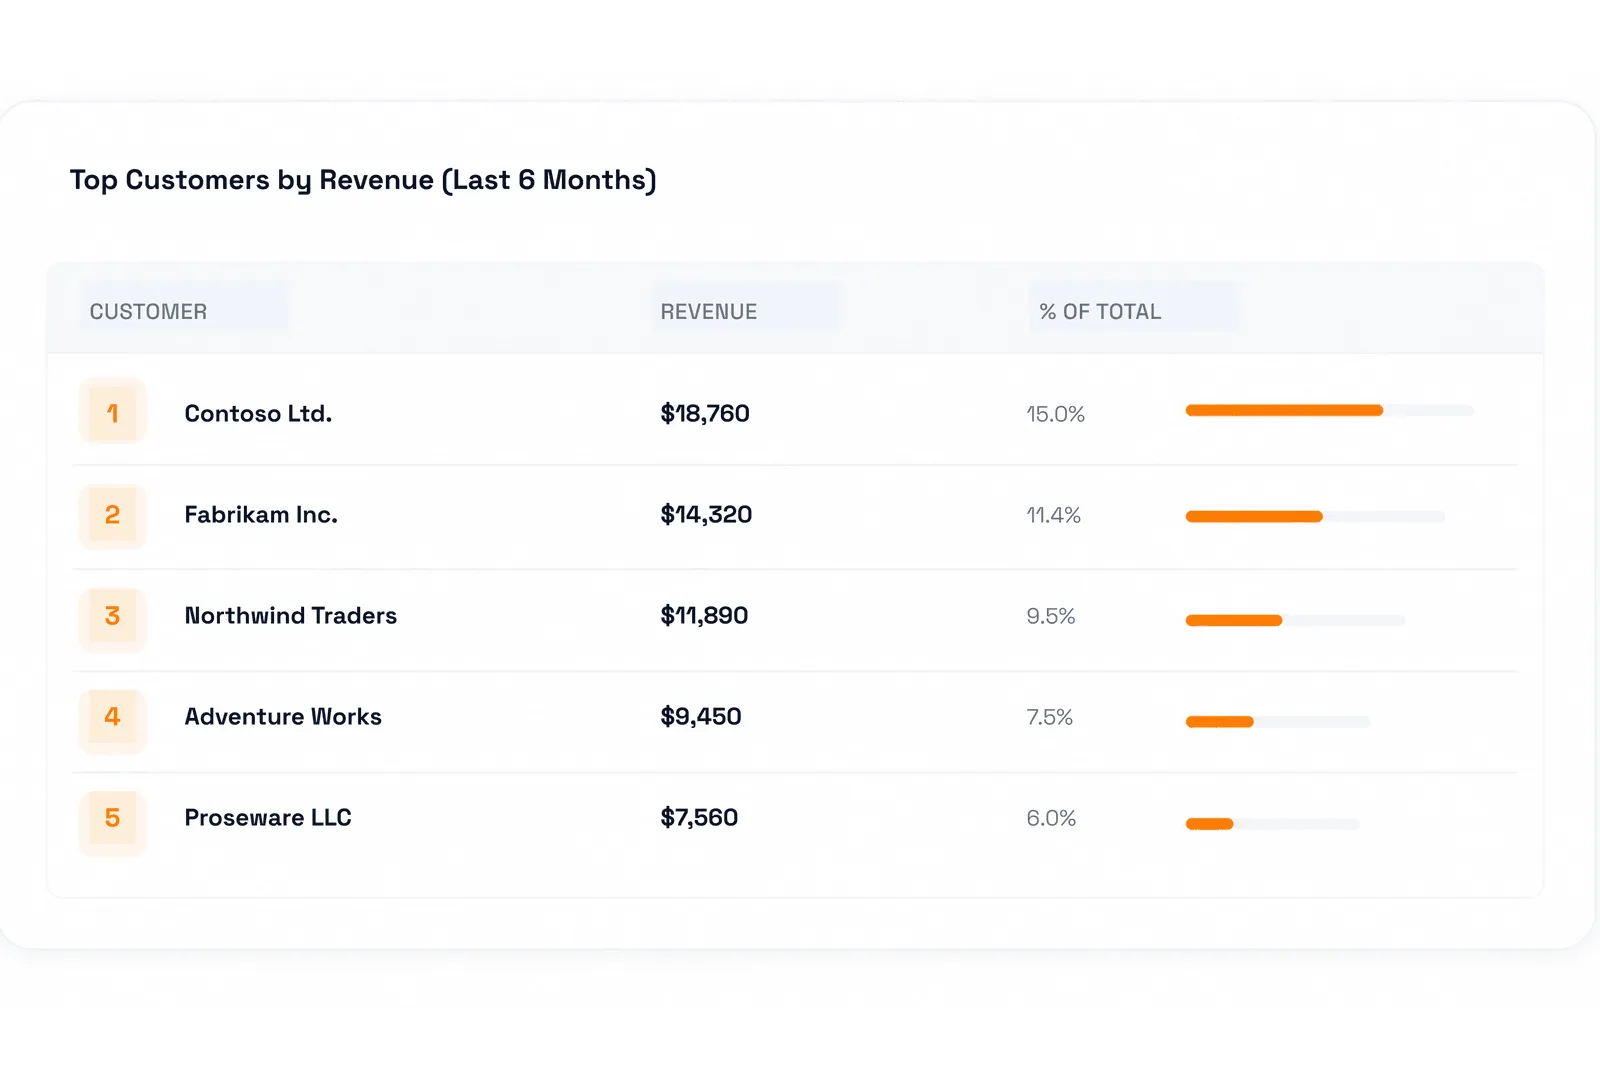
Rank your customer base over three, six or twelve months, or by billing period, so account focus follows revenue rather than habit. The portlet lists each account with its share of the total, and the same ranking carries into the detailed reports, where any customer on the list can be opened out into profitability, license positions or unpaid dues. Account managers can be filtered to their own book, and help desk users see only the customers assigned to them.
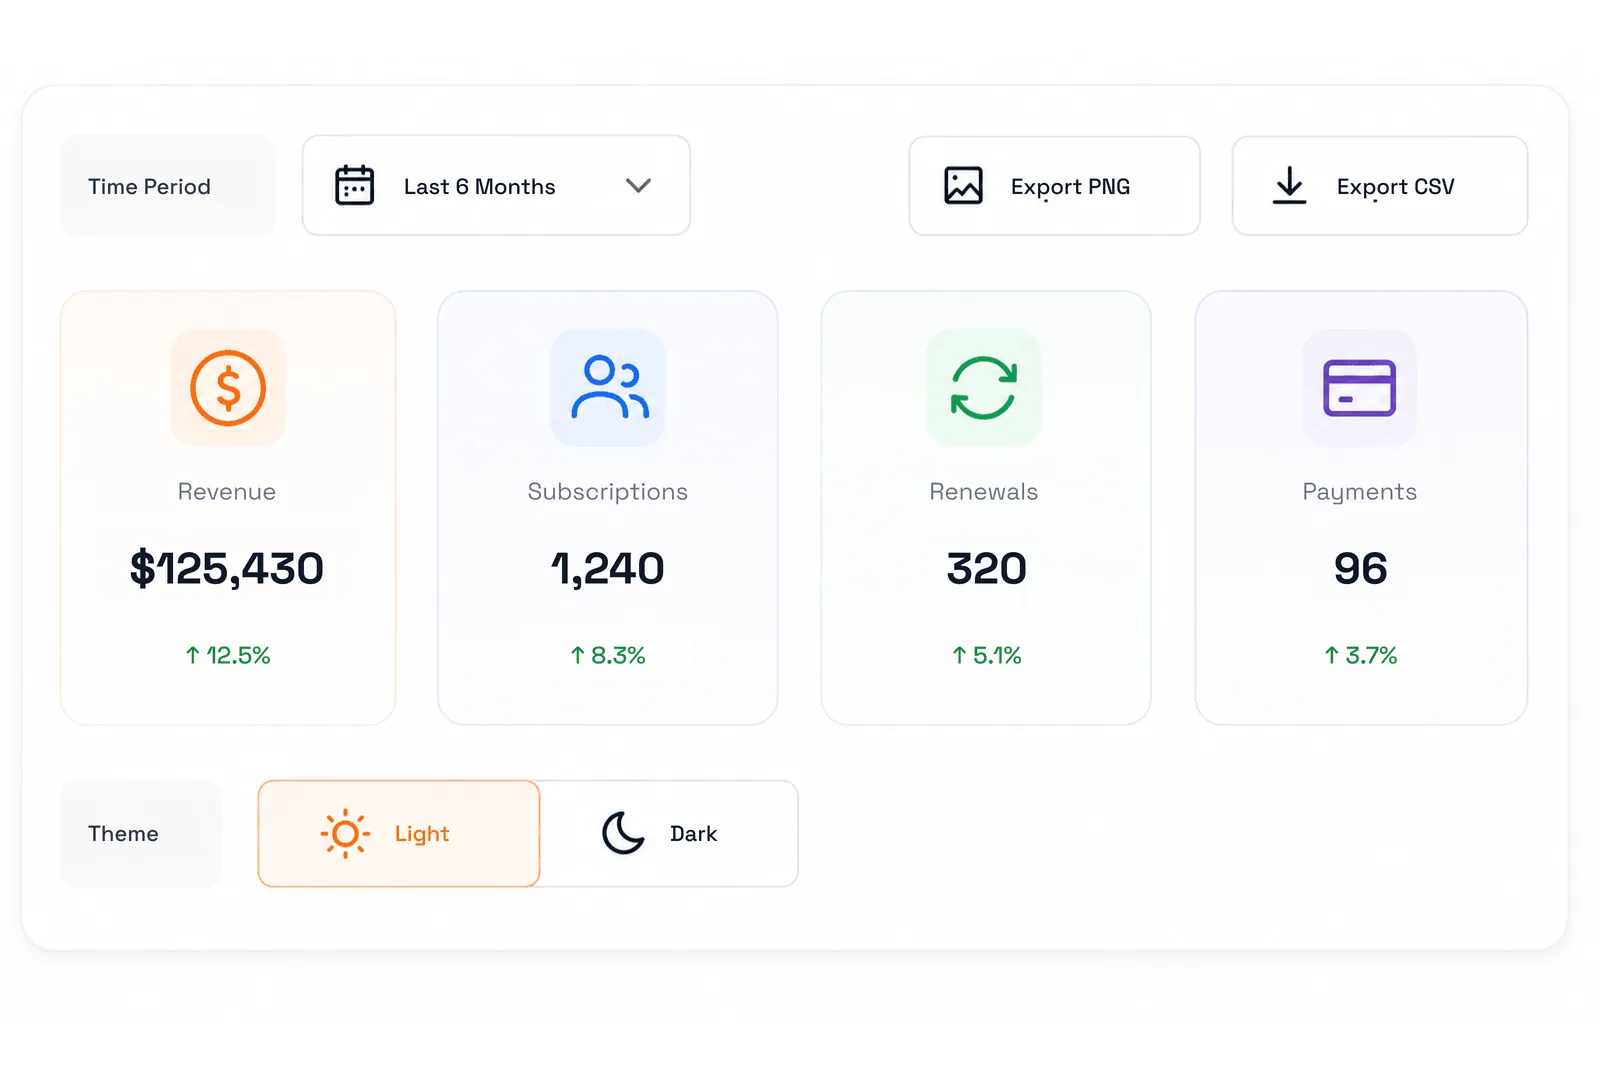
Time-period filters on any portlet, export as PNG or CSV for a board pack, and custom dashboard tiles with your own icons, colors and links. Each user saves their own favourite filters, so the view they need is the view that loads, and reports can be scheduled for delivery without anyone logging in to generate them. Effectively every report exports to Excel or CSV, and both light and dark themes are supported.
Report library
Track billing, subscriptions, Azure usage, profitability and operations in one place.
Profit against cost across customers, products and usage types, with multi-period billing selection.
Distributor-level profitability and margin per reseller.
Calculate and report commissions for account managers and partners.
Every report on this tab exports to Excel or CSV and can be scheduled for delivery.
Current positions by customer, site and department, with auto-renew editable in the report.
Additions, reductions and movements over time, with renewal, expiration and T&C detail.
Assigned versus purchased seats.
A customizable audit of every lifecycle change.
Auto-renew can be changed from inside the License Summary report itself.
Standardized columns, provider invoice numbers on NCE bundle lines, saveable preferences.
Including Microsoft cost, tenant ID, state and tax percentage.
Partner cost against customer billing, filtered by status, provider and category.
Unpaid and partially paid positions, downloadable for customers and resellers.
Invoices and dues are downloadable by customers and resellers in their own portal.
By customer, subscription, entitlement, resource group, service and tag, exportable with meters and regions.
Granular, on-demand analysis, extendable to selected customers.
Azure consumption is tracked daily, so it is visible long before the invoice arrives.
Identify where customers stall and which customers have yet to onboard.
Customer limits and current utilization, so you can see who is close to theirs.
Every GDAP relationship exported to CSV, with POR and MPN validation reporting.
Price Lists, Product Catalogue and User Assignment, with term duration.
Help desk users see only the customers assigned to them.
Delivered on your own schedule without anyone logging in to generate them, including the Non-Onboarded Customer List for onboarding follow-up.
Each user can save their preferred report views and download settings, so their filters are automatically applied the next time they return.
Filter the customer base by account manager, and scope visibility by role so finance, sales, support and help desk users each see only their own slice.
Active Offers, Active Customers, Customer Active Subscriptions, Purchased Products, License Consumption, Coupons, Billing, T&C Consent Logs.
Excel and CSV export is available on effectively every report in the library.
Give customers their own view of usage, invoices and billing history — and field far fewer questions.
Full profitability, cost, margin and reconciliation across every customer, product and category, scoped by role so each team sees what it should.
Every customer, product and category
Each team sees what it should
Usage, consumption, invoices, dues and billing history for their own account only, inside your branded portal.
Their own account only
Inside your branded portal
Outcomes
Strategy on current data, a repeatable month-end, and the operational picture prebuilt.
| Profit & margin | Manual reporting | With CSP Control Center |
|---|---|---|
| Customer profitability | Assembled at quarter-end from two systems | Revenue against cost, on demand, per customer |
| Margin leakage | Visible only in aggregate | Traceable to customer, product and category |
| Azure consumption | Monthly export and manual analysis | Daily, down to resource group and tag |
| Month-end & operations | Manual reporting | With CSP Control Center |
|---|---|---|
| Unpaid invoices | A spreadsheet that ages daily | Live dues position, filterable and exportable |
| Upcoming renewals | Found when one is missed | Tracked centrally with expiration alerts |
| Customer questions | Handled by your team | Answered in the customer's own portal |
Manual reporting Partner Center exports, billing spreadsheets and a BI file rebuilt by hand every month. By the time the numbers are assembled they describe last quarter, profitability is only visible in aggregate, and every customer question about usage or an invoice comes back to your team. | CSP Control Center A live business dashboard on login, detailed reporting across profitability, licensing, billing, Azure consumption and operations, and Power BI analytics on your own C3 data — scheduled for delivery, saved per user, and extendable to customers in their own portal. |

CSP Business Owner
Strategy on current data
Profitability by account, growth by product and the renewal pipeline are available on login rather than on request.

Finance & Billing Manager
Month-end is repeatable
Reconciliation, dues, invoice line items and tax detail export cleanly and reconcile to the ledger, with saved filters.

Operations Manager
The operational picture, prebuilt
License positions, change history, onboarding progress and consumption trends without building it by hand.
A live business dashboard plus detailed reporting across profitability (revenue and cost summary, reseller revenue and cost, commissions), licensing (license summary, license change, license consumption, subscription history), billing (invoice line item, invoice summary, reconciliation, invoices and dues), Azure consumption, and operations (onboarding, transaction limits, GDAP, POR validation, price lists, product catalogue).
Yes. Revenue and cost analysis filters by customer, product, category, usage type and billing period, so profit against cost is visible at every level rather than only in aggregate.
Yes. CSP Control Center provides a Power BI-based Azure usage report and advanced Power BI analytics as an on-demand capability, built on your live C3 data, and the Azure usage report can be extended to selected customers.
Yes. Reports can be scheduled for automatic delivery, users can save personalized favorite filters and download preferences, and effectively every report exports to Excel or CSV.
Yes. CSP Control Center exposes APIs covering active offers, active customers, customer active subscriptions, purchased products, license consumption, coupons, billing data and terms and conditions consent logs.
Yes. Usage, consumption, invoice and billing history reporting can be extended to customers through their portal, with visibility controlled by role.
Dashboards and reports run on your current CSP Control Center data, including Azure consumption processed daily, so decisions are made on today's position rather than last month's spreadsheet.
Yes. Role-based access control scopes reporting by role, and help desk users see only the customers assigned to them. Account manager filtering segments reporting by account ownership.