 CloudEvents
 SaaSify

A lot of CSPs are seeing business growth as they acquire new customers, seat counts increase, and recurring revenue continues to rise. But growth alone does not guarantee profitability or long-term stability. As the number of customers increases, operational complexity grows just as quickly. You are no longer just managing licenses; you are managing renewal cycles, pricing changes, usage fluctuations, and evolving customer expectations across multiple tenants.
As your business grows, revenue increases, but margins often tighten. You might be able to retain customers, but their overall spending might be declining. You might have strong sales numbers and still struggle with billing accuracy or delayed collections. When you reach this point, revenue alone stops being a reliable indicator of performance.
The difference between average and high-performing Microsoft CSPs is not the size of their portfolio. It is defined by the Microsoft CSP KPIs they track and how consistently they act on those CSP performance metrics. Most CSPs only track revenue and seat count to assess their performance. Without clear and actionable KPIs, many CSPs often find themselves dealing with margin leakage, billing inconsistencies, and reactive decision-making.
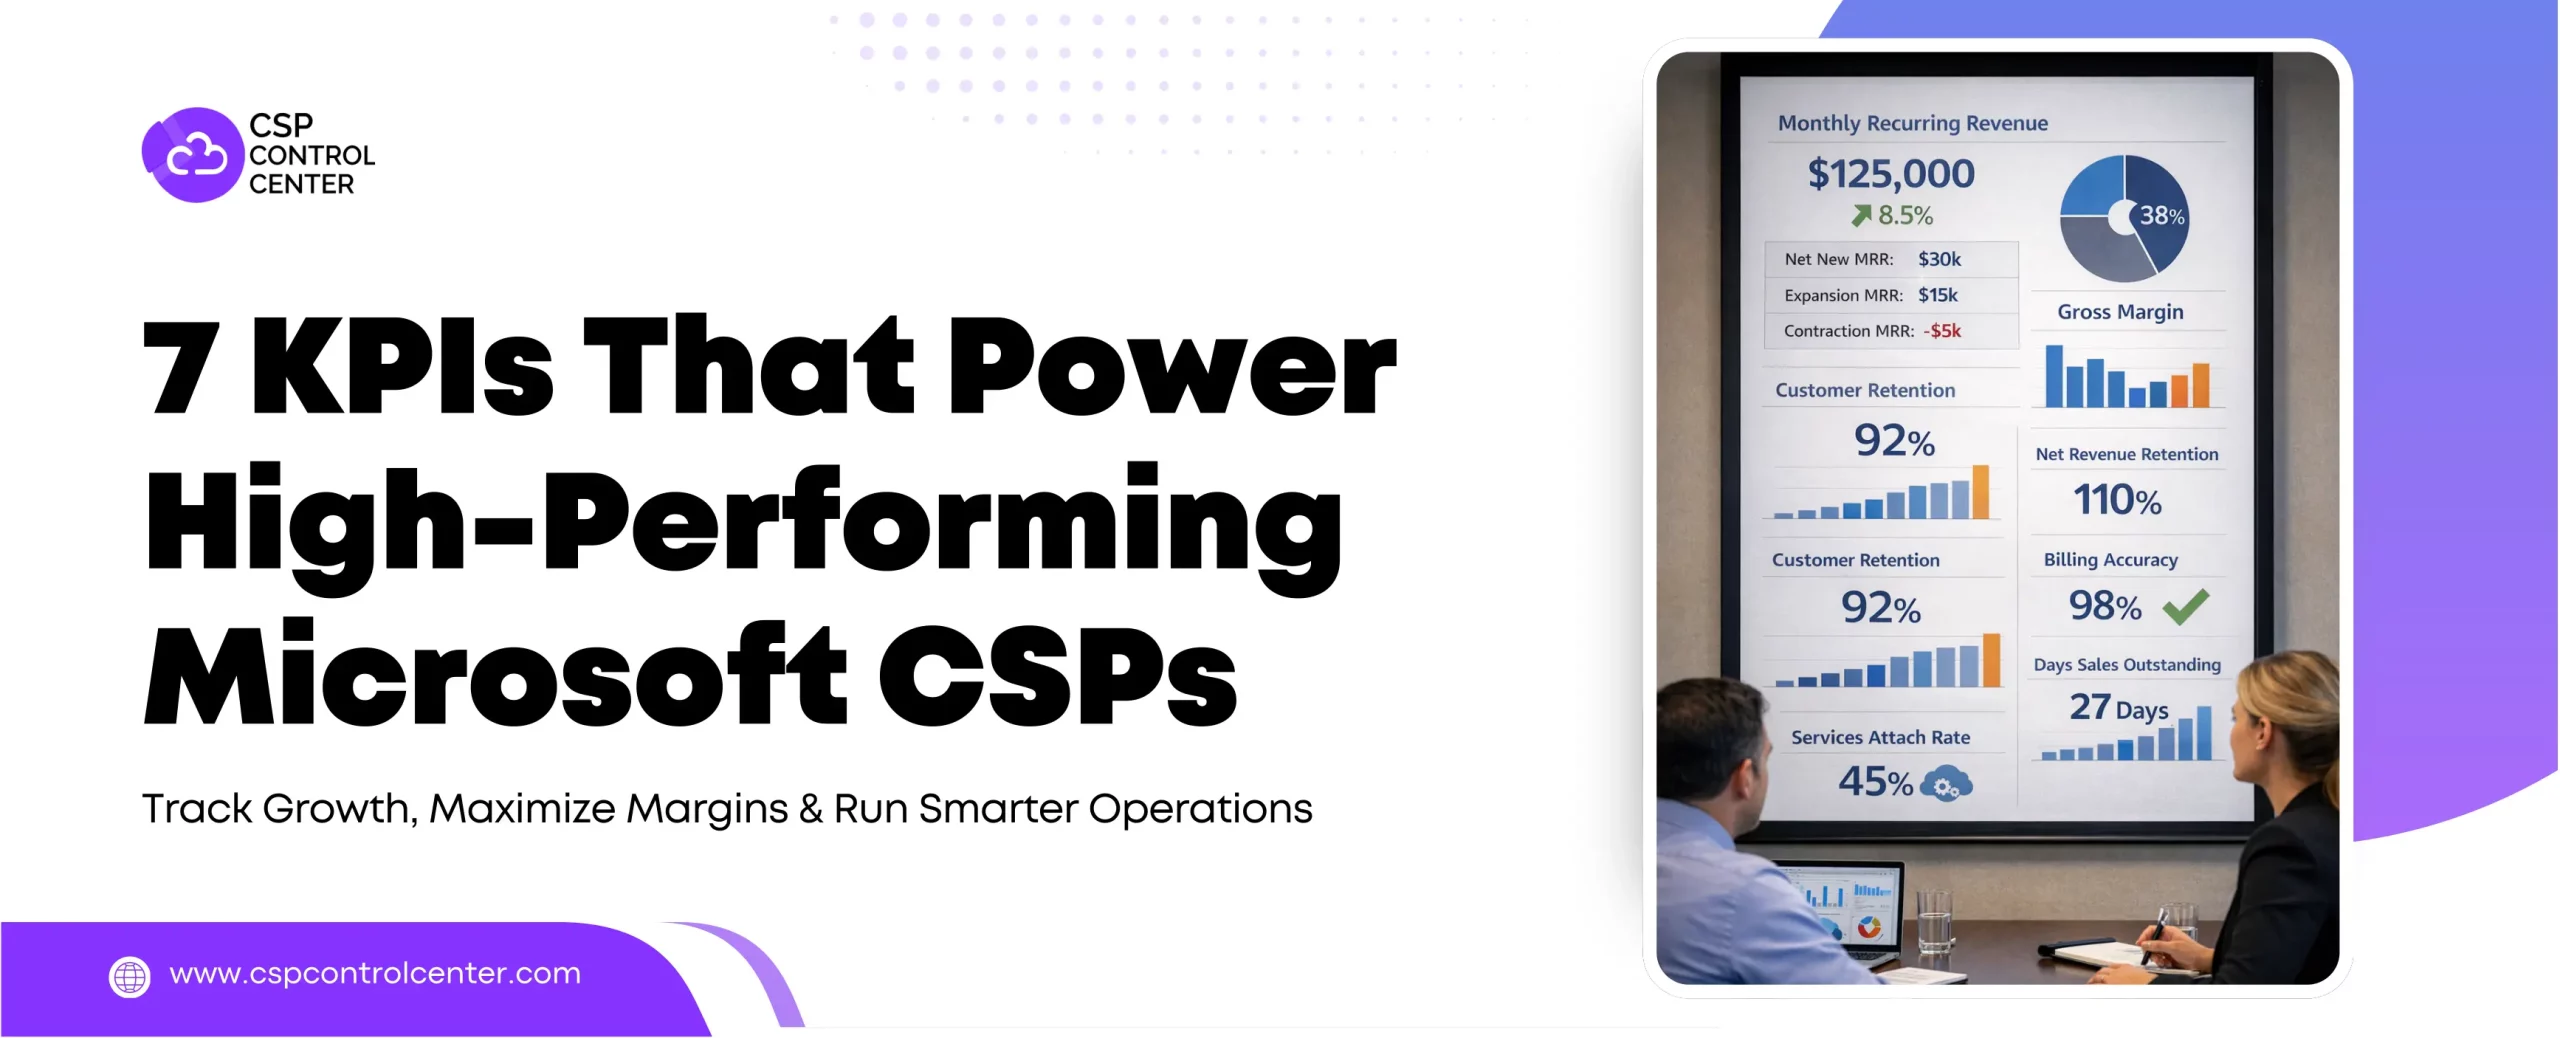
In this blog, we will look at seven KPIs that actually define performance in the CSP model. More importantly, we will look at how high-performing Microsoft CSPs operationalize these metrics to build predictable, scalable, and profitable businesses.
Why Traditional Metrics Fall Short in the CSP Model
Many CSPs rely on familiar metrics such as total revenue, number of customers, or licenses sold. While these traditional metrics are easy to track, they only offer a high-level view that is not enough for informed decision-making. The CSP model introduces layers of complexity that traditional metrics simply cannot capture. As a Microsoft CSP, you deal with subscription lifecycles that change frequently, multi-tenant environments with varying usage patterns, and billing structures that depend on both fixed licenses and consumption. On top of that, pricing is often influenced by Microsoft pricing changes, incentives, and program updates. With the introduction of the New Commerce Experience (NCE), subscription terms, pricing structures, and renewal conditions have become more standardized but also more complex to manage at scale.
When you depend on fragmented data from spreadsheets and the Microsoft Partner Center, you often end up with a delayed view of your business health. The result is disjointed decision-making and delayed insights that prevent timely action.
High-performing CSPs recognize this limitation early and move beyond surface-level metrics and focus on operational indicators that reflect the true health of the business. These metrics capture not just how much revenue is coming in, but how sustainable, efficient, and scalable that revenue actually is.
Metric 1: Monthly Recurring Revenue (MRR) Growth Rate
Monthly Recurring Revenue is often the starting point for measuring performance in a subscription-based business. MRR growth rate measures the month-over-month change in recurring revenue and is one of the most widely tracked Microsoft CSP growth metrics. It captures how much revenue is actually recurring and predictable, helping you determine whether growth is steady and sustainable or just driven by one-time deals.
High-performing partners do not just look at total MRR; they break it down into:
- Net New MRR: This measures the revenue added from entirely new customers and reflects how effective your acquisition strategy is.
- Expansion MRR: This tracks the additional revenue generated from existing customers through seat increases or license upgrades.
- Contraction MRR: This captures the revenue lost when customers downsize their commitments or move to lower-cost SKUs.
This gives a much clearer picture of the quality of growth. For example, strong expansion MRR usually reflects effective upsell, while too much dependence on new customer revenue can become a risk if customer acquisition slows down.
High-performing CSPs also segment MRR by solution category, customer type, and geography, and track expansion revenue separately from new sales. This helps them see exactly where growth is coming from, which products are gaining traction, and where early signs of contraction are emerging before they turn into a retention problem.
A common mistake is focusing only on total MRR without understanding what is driving it. Without that context, it becomes difficult to make informed decisions on pricing, sales strategy, or customer engagement.
Metric 2: Gross Margin per Subscription
Gross margin per subscription is a critical CSP performance metric that shows how much revenue remains after accounting for Microsoft licensing costs, discounts, and service delivery effort. In a model where Microsoft sets the base cost and partners compete on pricing. This is the metric that tells you whether a deal is profitable or just adding volume without real value. This KPI matters as in the CSP model, the margins on license resale are limited, and even small inefficiencies can quickly compound into significant losses.
There are several factors that influence this Gross margin:
- Discounting strategies can quickly erode margins if not controlled
- Microsoft incentives can improve profitability, but require accurate tracking
- Billing accuracy plays a direct role in ensuring that all revenue is captured correctly
High-performing CSPs do not just look at gross margin in aggregate. They track it at both the SKU level and the tenant level. SKU-level visibility shows which offerings are actually contributing to margin and which ones are being discounted too heavily. Tenant-level visibility helps them understand which customers are profitable to serve and which ones are consuming more in support and operational effort than they bring in. Getting this right requires bringing together billing data, licensing costs, and operational overhead into a single, unified view.
At scale, trying to manually reconcile this across multiple tenants quickly becomes unsustainable. This is where having the right billing systems and automation in place becomes essential, especially for partners managing a large number of customer accounts.
Metric 3: Customer Retention Rate
Customer retention rate measures the percentage of customers who continue with you over a given period. It is a foundational metric for any recurring revenue business, reflecting how effectively you maintain relationships over time and protect your revenue base.
In the CSP model, retention does not always translate into stable revenue. A customer may continue to stay with you while reducing seat counts, downgrading plans, or shifting workloads away from Microsoft products, all while technically remaining an active account.
High-performing CSPs look beyond renewals and track usage patterns, support ticket activity, and license utilization to spot early signs of disengagement before it turns into churn. For example, if a customer’s utilization drops by 30 percent over a few months, that is already a warning sign, even if the contract is still active. Microsoft CSPs who pick up on this early have time to step in with a conversation, offer training, or recommend the right solution.
A common mistake is to treat a customer as retained simply because they have not churned, while ignoring the signals that actually matter. By the time churn becomes visible, the relationship is often already weakened.
Metric 4: Billing Accuracy Rate
Billing accuracy rate tracks the percentage of invoices issued without errors, disputes, or post-delivery adjustments. It is one of the most overlooked Microsoft CSP KPIs, despite its direct impact on profitability.
The impact of billing errors shows up across three areas:
- Revenue leakage: Undercharging or missed fees that never get recovered directly impact margins.
- Customer trust: Repeated invoice inaccuracies create friction and make the business appear unreliable, regardless of service quality.
- Payment delays: Disputed invoices stay pending and delay collections, even though you have already paid Microsoft, putting pressure on cash flow.
Maintaining billing accuracy across hundreds of tenants is complex due to varying subscriptions, pricing, and billing cycles. Aligning Microsoft invoice data with internal pricing is difficult to manage manually, often creating gaps that go unnoticed, allowing errors to carry over across multiple billing cycles.
Leading CSPs address this by standardizing their billing workflows and putting systems in place that align Microsoft invoice data with their internal pricing. This reduces reliance on manual processes and brings much-needed consistency. They also focus on automating reconciliation and invoicing. This helps them catch discrepancies early and ensures invoices go out accurately and on time.
A common mistake is to treat billing errors as isolated incidents and fix them after they occur, rather than building systems that prevent them altogether.
Metric 5: Net Revenue Retention (NRR)
Net Revenue Retention is one of the most important metrics for understanding long-term growth. It measures how much revenue you retain from existing customers after accounting for expansion, contraction, and churn. In the CSP context, NRR reflects how effectively customer success and sales efforts are working together. NRR increases when customers expand their usage and declines when they reduce spend or leave.
For CSPs, expansion can come from multiple sources, such as upselling to higher-value plans like E5, adding security or compliance solutions, and increasing Azure consumption over time. Over time, this expansion contributes to increasing customer lifetime value, particularly when supported by billing automation that ensures accuracy, consistency, and a better customer experience.
What separates high performers is that they use usage and engagement data to guide expansion conversations instead of waiting for renewal cycles. A customer nearing storage limits, increasing their Teams usage, or showing signs of identity management complexity is already indicating an expansion opportunity. CSPs who track and act on these signals early are able to drive NRR upward, while those who do not often leave that revenue unrealized.
A common mistake is not separating true expansion from pricing-driven increases. If revenue goes up because Microsoft has raised prices, that is not meaningful expansion. This metric only becomes meaningful when actual upsell and cross-sell are tracked separately.
Metric 6: Days Sales Outstanding (DSO)
Days Sales Outstanding measures the average number of days between issuing an invoice and receiving payment. In the CSP model, where you often have to pay Microsoft on a fixed schedule, a high DSO can create a dangerous cash flow gap.
This gap becomes increasingly difficult to manage as you scale and transaction volumes grow. With a large customer base, high DSO, and monthly Microsoft payment obligations, you are effectively financing your customers’ subscriptions.
One of the main drivers of high DSO is inconsistent or delayed invoicing. When invoices do not accurately reflect current subscription states, usage changes, or mid-cycle updates, customers raise concerns, dispute line items, or delay payment until things are clarified. Every extra day spent resolving these issues is a day that cash flow gets delayed.
High-performing CSPs address this by automating invoicing and collections workflows and ensuring every invoice is timely, accurate, and clearly tied to actual customer consumption. When billing data is reconciled automatically and invoices are generated without manual intervention, accuracy improves, and delays are reduced.
This is where modern billing platforms play a key role. By bringing Microsoft data, internal pricing, and invoicing into a single system, they remove the fragmentation that often leads to errors. This leads to accurate invoicing and faster payments.
Beyond automation, high performers segment customers based on payment behavior and apply different credit and collections approaches accordingly. A customer with a consistent on-time payment track record does not need the same level of follow-up as one with a pattern of disputes and delays.
A common mistake is applying the same credit policies across the entire customer base. This spreads collections effort too thin and allows high-risk accounts to go unchecked without timely intervention.
Metric 7: Services Attach Rate
As the CSP market becomes more competitive, relying solely on license resale is no longer enough. Services attach rate measures the percentage of deals or customers that include additional services such as managed services, security offerings, migration, or ongoing support. It is the KPI that most clearly determines whether you have a differentiated, defensible business or one that remains constantly exposed to licensing margin pressure.
CSPs that rely primarily on license resale end up competing on price by default. The Microsoft SKU is the same regardless of which partner sells it, so discounting becomes the only real way to stand out. Over time, this puts continuous pressure on margins.
CSPs who attach services to their licensing base improve margin per customer, increase switching costs, deepen the customer relationship, and create revenue streams that are not tied to Microsoft’s pricing decisions. In 2026, with continued pressure on transactional margins from NCE pricing structures, service attach is no longer just a growth strategy. It is what allows CSPs to move beyond price-driven margins and build a more resilient business.
High-performing CSPs build services into the subscription from the start instead of adding them later as an afterthought. They use usage data and lifecycle signals to identify where managed services, security, or support can add value, and align sales and delivery teams to drive service attach in a consistent, structured way rather than relying on one-off opportunities.
Tracking service attach at scale, however, requires clear visibility into both subscription data and service delivery across tenants. Many CSPs struggle to connect these data points when systems are spread across billing tools, PSA platforms, and Partner Center.
As a result, leading partners are moving toward more integrated platforms that bring subscription management, billing, and service tracking into a single view. This makes it much easier to identify where services can be introduced or expanded within the existing customer base.
How High-Performing CSPs Use These KPIs Together
These seven Microsoft CSP KPIs are interconnected and together give a complete view of business health. Billing accuracy impacts DSO by affecting payment cycles, which in turn influences cash flow and your ability to reinvest in growth. NRR reflects both retention and service attach effectiveness, while MRR growth shows business direction and gross margin per subscription confirms whether that growth is truly profitable.
When you track all seven together, you get a clear and reliable view of business performance. Looking at only two or three in isolation often creates a fragmented view and leads to decisions that solve the wrong problem.
Achieving this level of visibility is not easy when data is spread across disconnected systems. Most CSPs operate with a mix of Partner Center, spreadsheets, and internal tools, and bringing all of this together manually creates delays. By the time the data is consolidated and reviewed, the picture you are looking at is already slightly behind what is actually happening in the business. That gap may seem small, but at scale it can lead to missed signals and slower decision-making.
This is why leading partners are moving toward more integrated CSP platforms that bring billing, subscription management, and KPI reporting into a single, consistent view. When everything sits in one place, the data is not only more reliable but also easier to interpret. The goal is not just to have better visibility, but to act on that visibility in time. The real advantage comes from being able to spot issues early, respond quickly, and make decisions before they start affecting revenue, margins, or customer relationships.
From Measurement to Action: Building a KPI-Driven CSP Organization
Defining KPIs is only the starting point. The real challenge is turning those metrics into consistent action across the business. Many CSPs reach a stage where dashboards are in place, reports are generated regularly, and numbers are reviewed, but very little changes in day-to-day operations.
For KPIs to have real impact, they need to be built into how teams operate, not just reviewed at the end of the month. This shift toward data-driven decision-making is critical. Data-driven enterprises outperform the average with around 4 percent higher productivity and 6 percent higher profits, reinforcing the need to move from tracking KPIs to actively using them in day-to-day decisions.
To build a KPI-driven organization, you need to take a structured approach.
Assign clear ownership of every KPI
Every KPI needs to have a clear owner who is responsible not just for tracking it, but for acting on it. When ownership is unclear, metrics tend to remain informational rather than actionable.
Define accountability and thresholds
Accountability is what ensures that ownership actually translates into action. It is not enough to just monitor performance. Teams need to know what acceptable ranges look like and what actions are expected when those thresholds are crossed. Without that, even visible issues like declining margins or rising DSO can continue longer than they should without any real intervention.
Strengthen operational infrastructure
Without a strong operational foundation, even well-defined KPIs remain underutilized. Many CSPs still rely on manual processes to track billing, reconcile invoices, and compile reports across tenants. This creates delays between identifying an issue and acting on it, and in a high-volume environment, those delays add up quickly.
Implement systems that enable real-time visibility
Move away from fragmented tools and manual processes by putting systems in place that bring billing, subscription data, and performance metrics into a single view. When data flows through one system instead of multiple disconnected ones, it becomes more reliable and easier to act on. This reduces lag between identifying an issue and responding to it, allowing decisions to be made in real time as problems occur.
Embed KPIs into daily workflows
KPIs need to show up in day-to-day decisions, not just monthly reviews. When teams use current data to guide actions, performance management becomes proactive rather than reactive.
The seven KPIs discussed in this blog provide a practical framework for measuring what truly matters. They help partners identify risks early, improve operational efficiency, and build a more predictable path to growth.
As the CSP ecosystem continues to evolve, partners that invest in the right metrics and the systems needed to act on them will be better positioned to scale efficiently and profitably.
Take Control of Your CSP Metrics with C3
Tracking the right KPIs is what separates growing CSPs from those that scale with control. CSP Control Center (C3) helps you move beyond fragmented tools and gain the single-pane visibility these seven KPIs demand. By unifying billing, subscription data, and performance tracking in a single system, C3 enables CSPs to move from manual processes to a more structured, data-driven approach. This makes it easier to track key metrics such as MRR, margins, billing accuracy, and collections in real time, while also identifying opportunities to improve service attach and customer value.
Instead of spending time reconciling data across systems, your teams can focus on acting on insights, whether that means addressing revenue leakage, improving cash flow, or driving expansion within existing accounts.
If you are looking to move beyond basic reporting and build a more KPI-driven CSP organization, you can book a demo to see how this works for your CSP business.